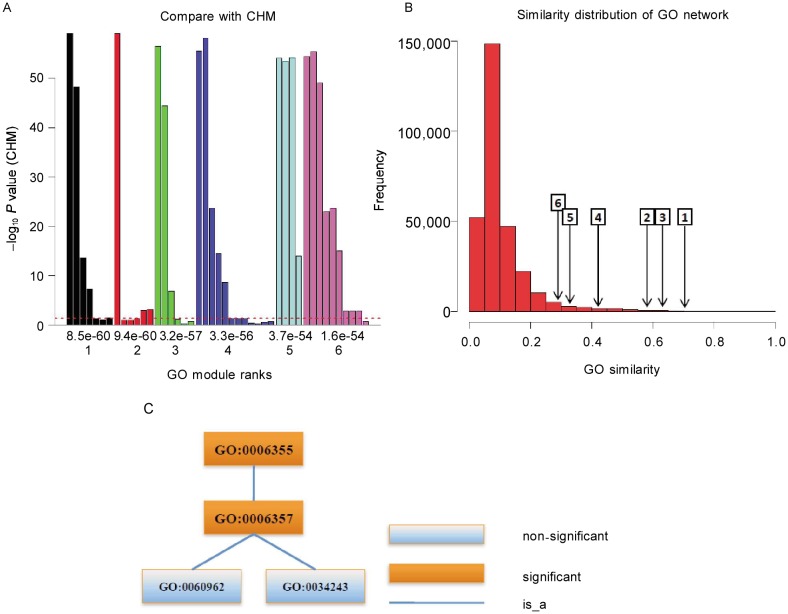
Figure 3. GO modules of yeast cell cycle transcription factor co-regulatory network.
A, comparison with CHM. The X axis is the rank (down) and P value (up) of GO modules. The Y axis is –log10(P value) of individual terms calculated by CHM. The maximal value of the Y axis corresponds to infinity. The dashed line denotes the P value cutoff of 0.05. There are five of six GO modules containing non-significant terms which are functional similar. B, similarity distribution of the GO network and the average similarities of GO modules. The number in the rectangle is GO module rank, and the arrow points to the corresponding average similarity. GO modules have high similarities, that is, GO modules are really functional similar. C, the term structure of the first GO module. The functions of GO modules are as follows: GO:0006355, regulation of transcription, DNA-dependent; GO:0006357, regulation of transcription from RNA polymerase II promoter; GO:0034243, regulation of transcription elongation from RNA polymerase II promoter; and GO:0060962, regulation of ribosomal protein gene transcription from RNA polymerase II promoter.

