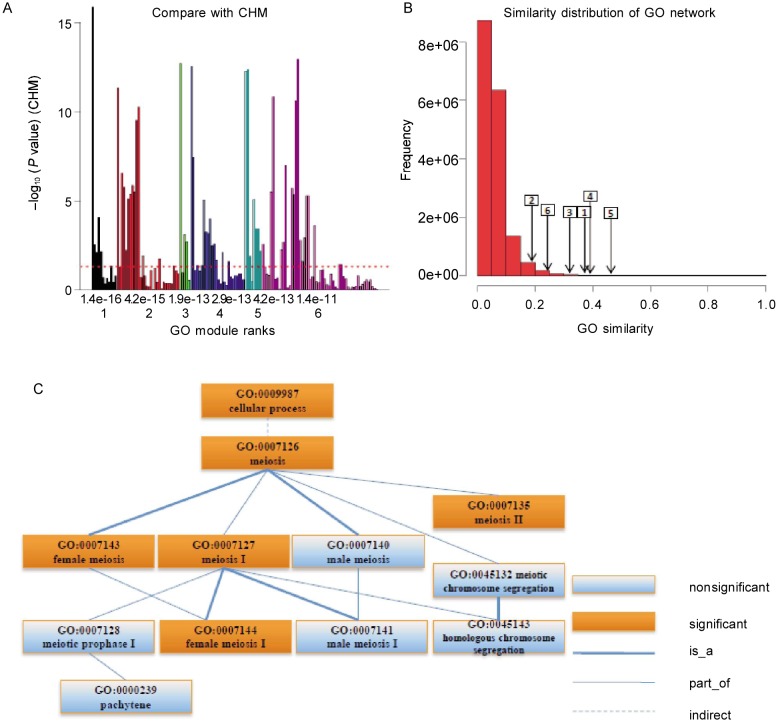
Figure 6. GO modules of breast cancer data.
A, comparison with CHM. The X axis is the rank (down) and P value (up) of GO modules. The Y axis is –log10(P value) of individual terms calculated by CHM. The maximal value of the Y axis corresponds to infinity. The dashed line denotes the P value cutoff of 0.05. Many non-significant terms are functional redundancy with the significant ones. GOMA collected them together as GO modules without the functional redundancy. B, similarity distribution of the GO term network and the average similarities of GO modules. The number in the rectangle is GO module rank and the arrow points to the corresponding average similarity. The high similarities for GO modules mean the densely subnetworks. C, the term structure of the first GO module shows more details about the functional relationships among the terms in one GO module.

