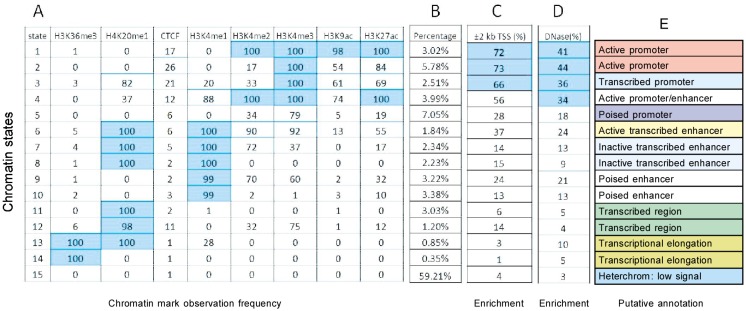
Figure 2. Results of CRF.

A, chromatin states learned by CRF models and the frequency with which a mark is found at each of these states. B, the percentages of these states in whole gene regions. C, enrichment of each chromatin state in transcription start site (TSS) regions. D, enrichment of each chromatin state in DNase I hypersensitivity regions. E, putative annotations for each chromatin state.
