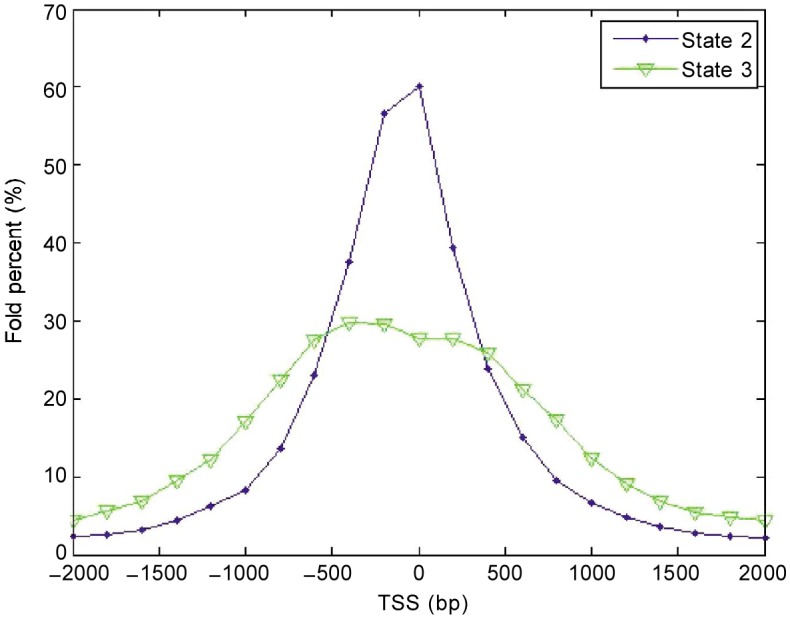
Figure 3. Fold percentage of states 2 and 3 in the TSS region retrieved by CRF.

The higher the fold percentage, the higher the concentration of a state at corresponding location. The states are concentrated at the transcription start sites.

The higher the fold percentage, the higher the concentration of a state at corresponding location. The states are concentrated at the transcription start sites.