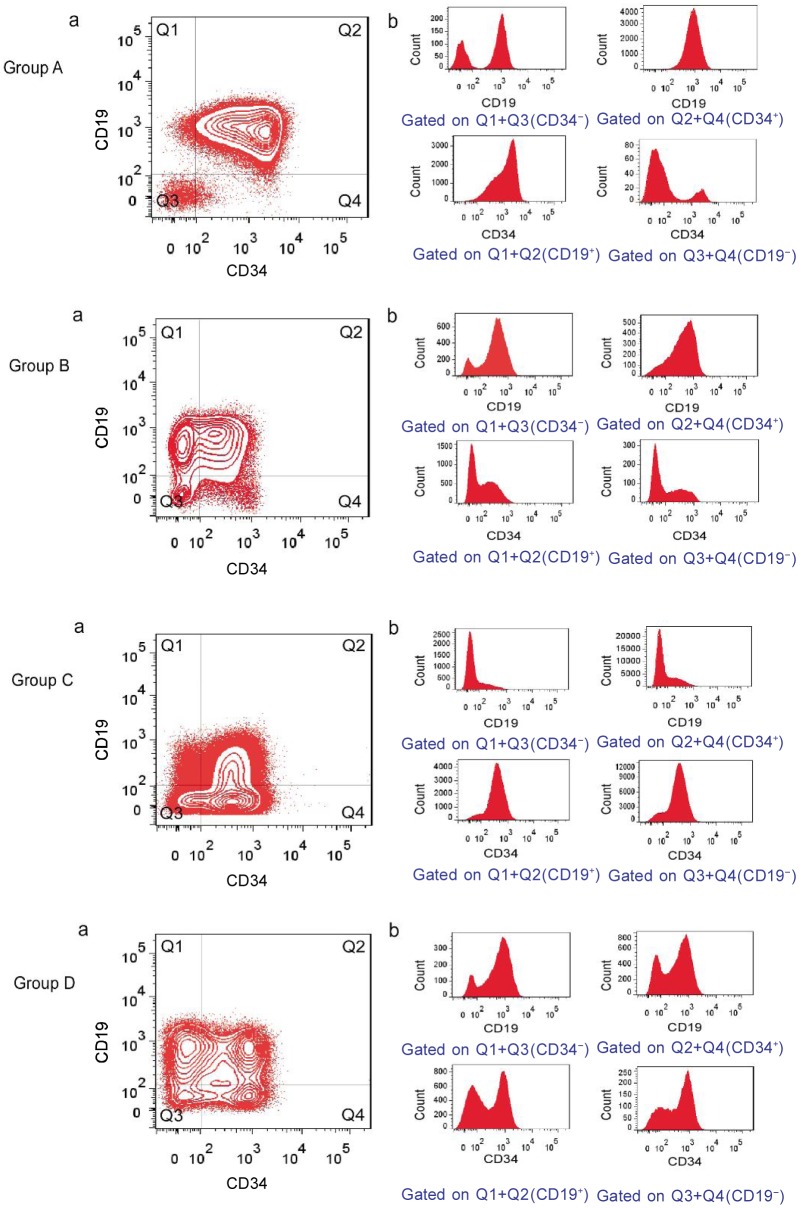
Figure 3. Examples of immunophenotypic patterns and heterogeneous antigen expression at the time of diagnosis for adult common ALL.
The contour plots (a) are all gated on leukemia cells (as shown in Figure 1). The histograms (b) are gated on selected fractions of leukemia cells as described below each plot. Immunophenotypic patterns were defined as groups A, B, C, and D, respectively.

