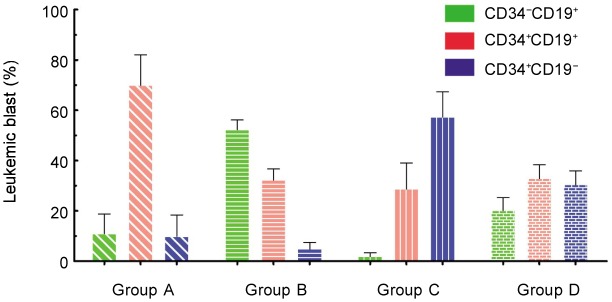
Figure 4. The ratio of CD34+ CD19+, CD34−CD19+, and CD34+ CD19− subpopulations to total leukemia cells for the four immunophenotypic patterns.

The ratio is defined as the percentage of indicated leukemia cells. The histogram represents the mean, and error bars represent the standard deviation.
