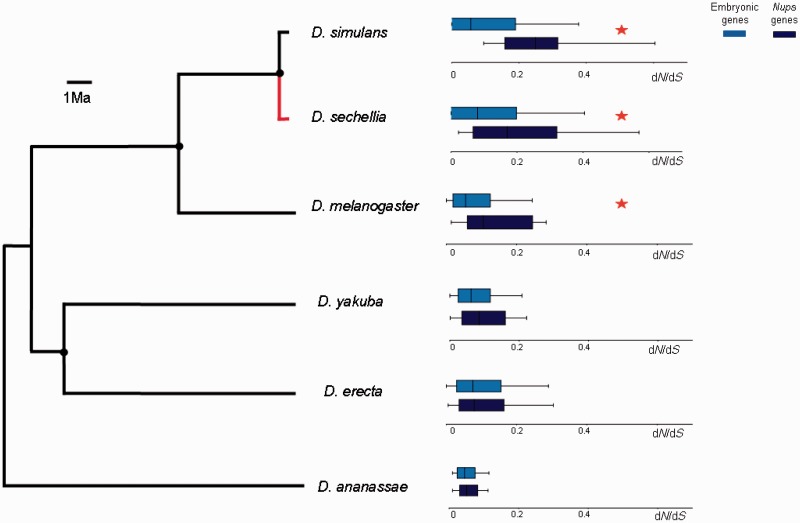
Fig. 4.—
Comparisons of the median dN/dS values between Nups and the rest of embryonic genes for the six species of the D. melanogaster group. Red asterisks show a significant difference in dN/dS between Nups and rest of embryonic genes in a Kolmogorov–Smirnov test, P < 0.05. Black circles indicate ancestral nodes where a comparison between inferred sequences of the respective most recent common ancestors and derived lineages was performed. Red line shows an acceleration of nonsynonymous substitution rate of Nups in D. sechellia linage in comparison with its last common ancestor with D. simulans (Wilcoxon Matched Pairs test: N = 15, Z = 2.7, P < 0.01). The rest of comparisons are not significant.

