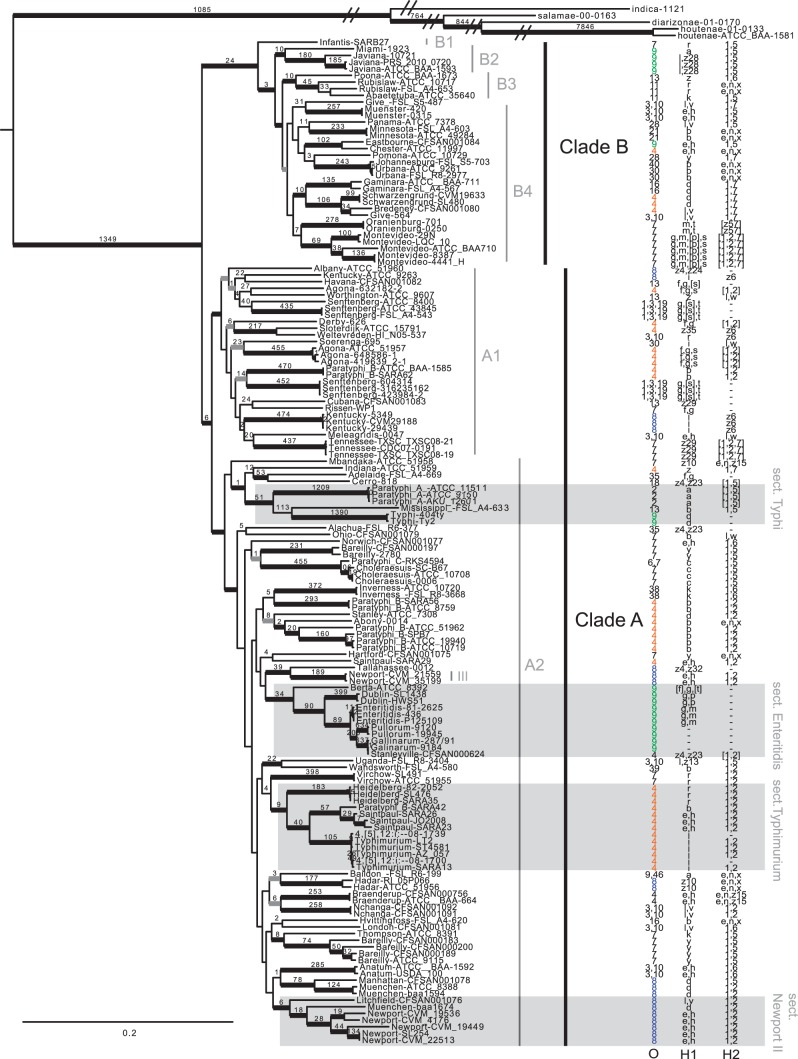
Fig. 1.—
Phylogenetic tree based on the maximum-likelihood method implemented in RAxML. Bold black branches represent 90–100% bootstrap support. Bold gray branches represent 70–90% bootstrap support. Numbers associated with branches are SNPs unique to that lineage. For the purposes of this figure, the long outgroup branches were shortened; however, the original tree is available for download at TreeBase.org. Three antigen characters are mapped onto this phylogeny: O group, Phase 1 (H) flagellar antigen, and Phase 2 (H) flagellar antigen.

