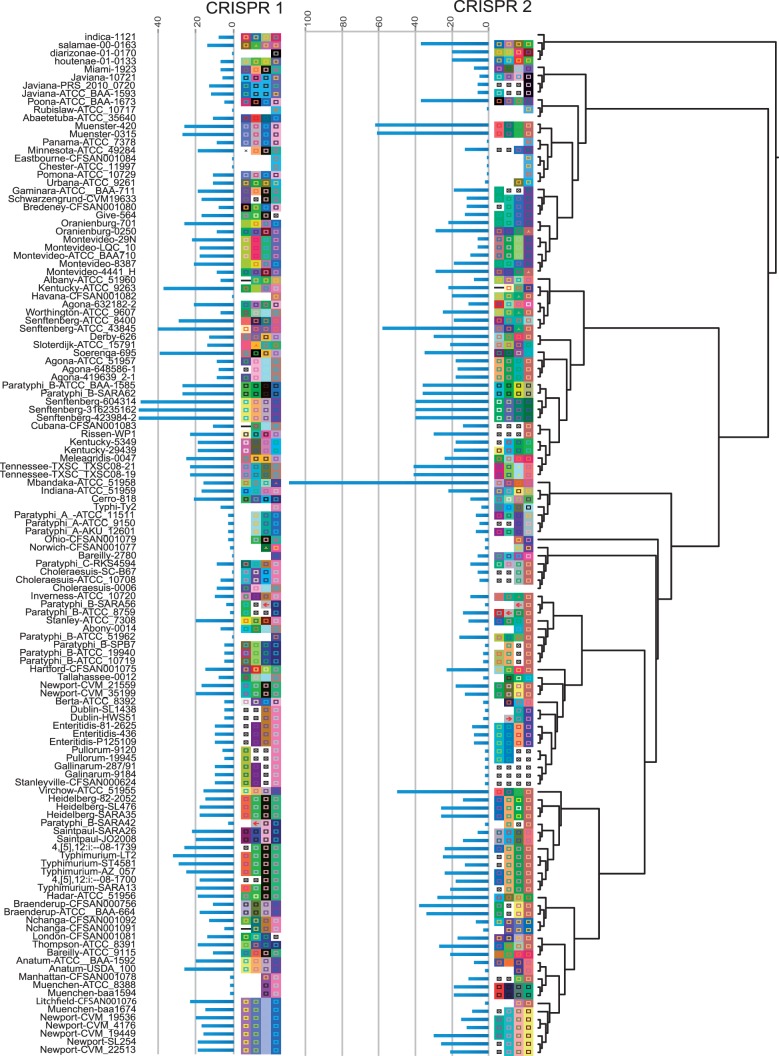
Fig. 4.—
ML phylogeny from figure 1, pruned for strains for which we have CRISPR data (126 in-house collected draft genomes plus published complete genomes). The four most ancestral spacers were extracted from the CRISPR alignment in supplementary data S4, Supplementary Material online and mapped onto the tree. Spacers with the same coloring represent the exact same underlying sequence. Different coloring represents different underlying sequence. Blue bars represent CRISPR length, which was determined from the number of unaligned spacers for each CRISPR locus. Spacer deletions are represented by a black square with an x.

