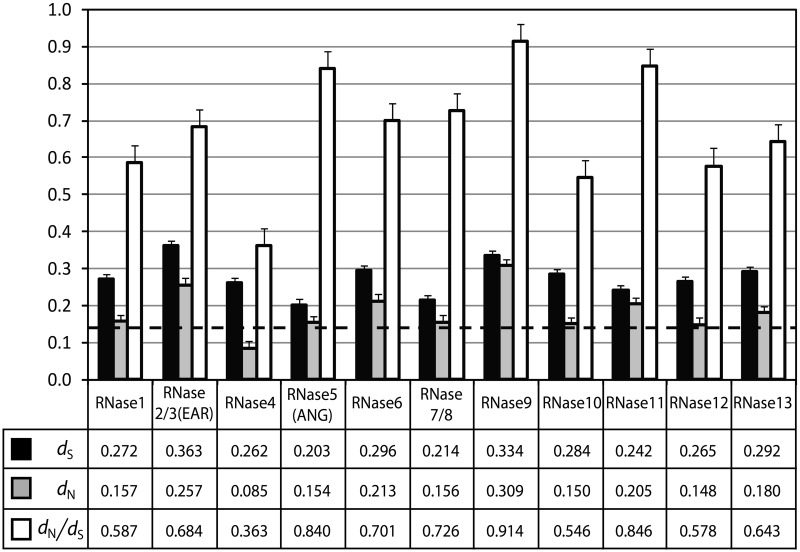
Fig. 3.—
Synonymous (dS) and nonsynonymous (dN) nucleotide distances between all possible orthologous gene pairs of the 13 ancient RNase gene lineages. Black bars indicate dS, gray bars indicate dN, and white bars indicate dN/dS. The genome-wise average dN/dS (0.144) of the six eutherian species measured by Groenen et al. (2012) is marked by the dashed horizontal line.

