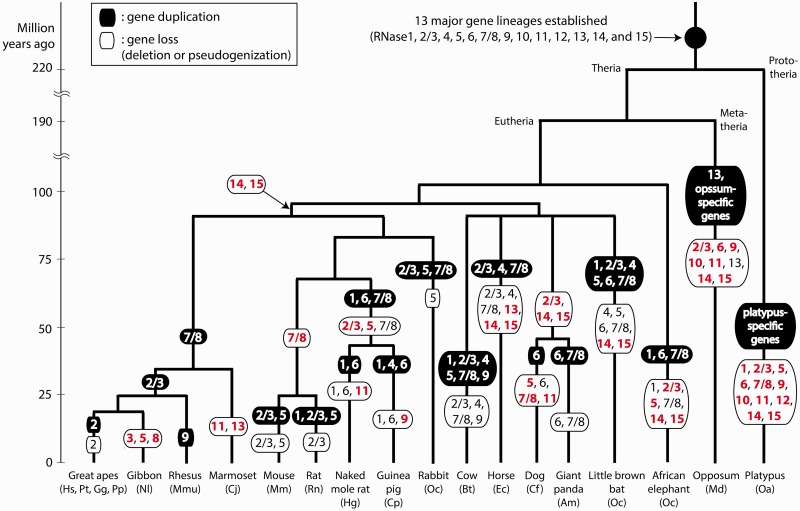
Fig. 6.—
Evolutionary history of the mammalian RNase A superfamily. Gene duplication and gene loss events are mapped on the branches of the phylogeny of the 20 mammals studied here. Permanent losses of gene lineages are labeled red and bold, whereas partial losses are black and nonbold. The phylogeny and divergence times followed Meredith et al. (2011).

