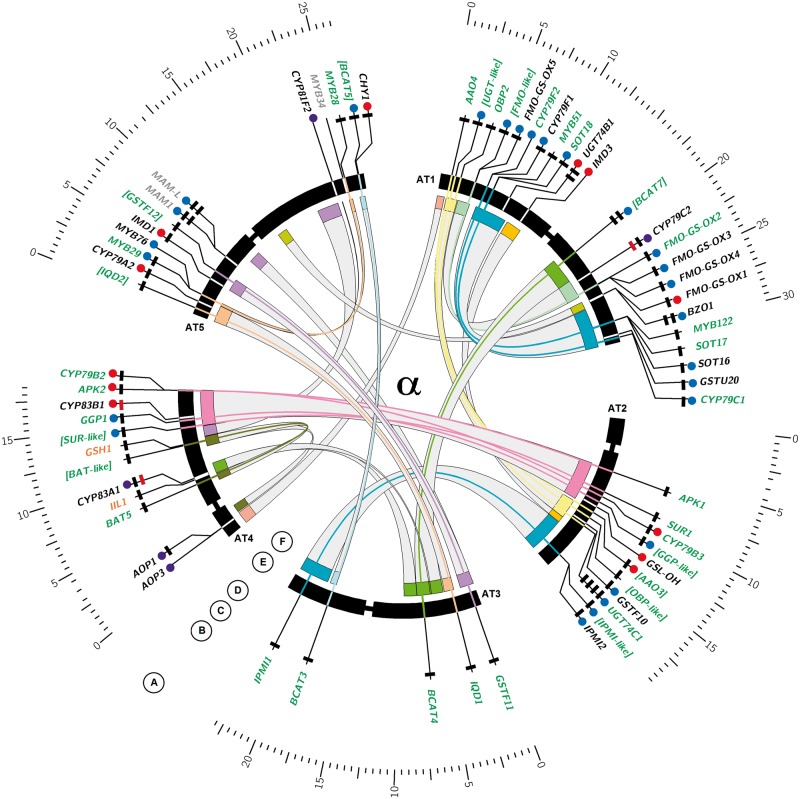
Fig. 3.—
Ideogram of Arabidopsis thaliana chromosomes with GS biosynthetic genes. Circos plot visualizing the evolutionary contribution of different duplication types to GS pathway inventory in Arabidopsis and Aethionema. (A) Inner chromosome scale (Mb). (B) Arabidopsis thaliana GS biosynthetic genes. Gray text indicates genomic location outside ohnolog blocks. Black text indicates genomic location within ohnolog blocks but nonretained ohnolog copy. Green text indicates retained pairs of ohnolog copies with missing GO annotation to GS biosynthetic process shown in edged brackets. Orange text indicates single copy genes without clear paralogs in both species. (C) Blue circles indicate genes organized in TARs (i). Red circles indicate genes with transpositional history (ii). Purple circles indicate loci sharing (i) and (ii). (D) Number of rectangles indicates number of homologs present in the Aethionema arabicum draft genome (0–4). Color of rectangles indicates presence (black) or absence (red) of synteny between A. thaliana and Aet. arabicum in the genomic context of the target gene. (E) Arabidopsis thaliana chromosomes with labels showing GS biosynthetic genes. Bands for genes retained in ohnolog pairs are connected with colors of corresponding ohnolog blocks, as defined by Bowers et al. (2003). (F) Genomic location of ohnolog block copies harboring GS biosnthetic genes in A. thaliana, connected by gray bands. All ranges are in scale.

