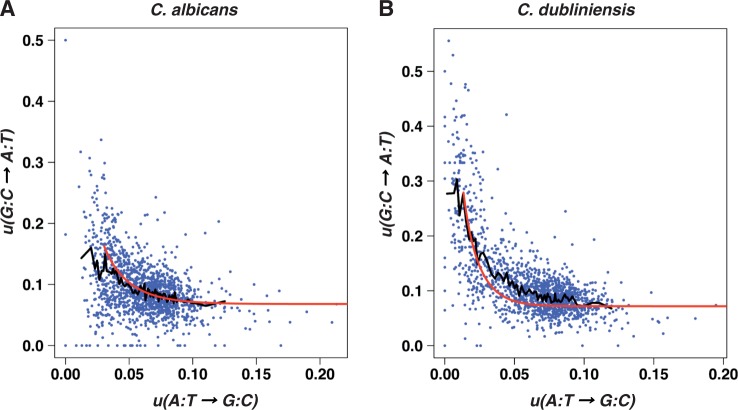
Fig. 2.—
Variations of the transition rate  as a function of the transition rate
  in the lineages of C. albicans (A) and C. dubliniensis (B). The red lines represent the theoretical curves corresponding to equations (4) and (5) for the estimates of the parameters given in the main text. The black lines correspond to moving average values that were computed for bins of 20 points.

