Fig. 3.—

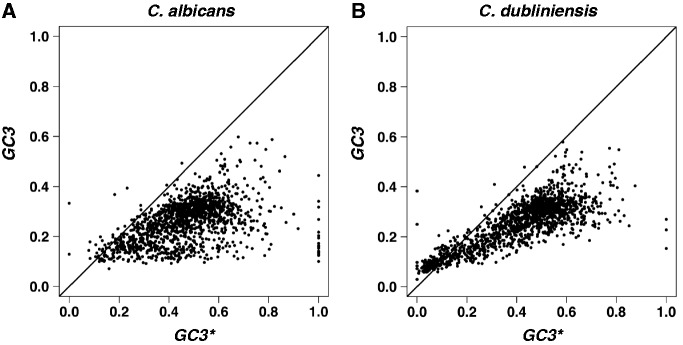
The present GC3 content, GC3, is plotted as a function of the equilibrium GC3 content,  , for C. albicans (A) and for C. dubliniensis (B). The solid lines correspond to the linear equation
  .
.

The present GC3 content, GC3, is plotted as a function of the equilibrium GC3 content,  , for C. albicans (A) and for C. dubliniensis (B). The solid lines correspond to the linear equation
  .
.