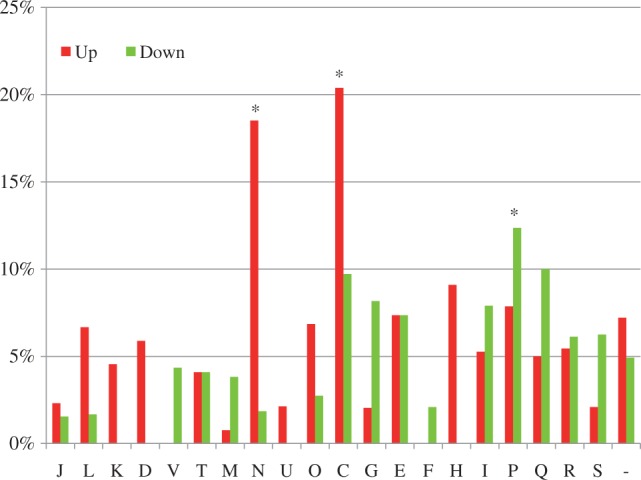
Fig. 3.—

Gene enrichment analysis of the differentially expressed genes between Campylobacter jejuni IA3902 and NCTC11168 detected by microarray. COG category codes are indicated on the x axis. The fraction of genes in each COG category is shown on the y axis. Red bars indicate genes up-regulated in IA3902, and green bars indicate genes down-regulated in IA3902. COG categories that are significantly enriched (P < 0.05, Fisher’s exact test) are indicated by an asterisk. COG category codes: J, translation; L, replication, recombination, and repair; K, transcription; D, cell cycle control, mitosis, and meiosis; V, defense mechanisms; T, signal transduction mechanisms; M, cell wall/membrane biogenesis; N, cell motility; U, intracellular trafficking and secretion; O, posttranslational modification, protein turnover, chaperones; C, energy production and conversion; G, carbohydrate transport and metabolism; E, amino acid transport and metabolism; F, nucleotide transport and metabolism; H, coenzyme transport and metabolism; I, lipid transport and metabolism; P, inorganic ion transport and metabolism; Q, secondary metabolites biosynthesis, transport and catabolism; R, general function prediction only; S, function unknown; and -, not in COGs.
