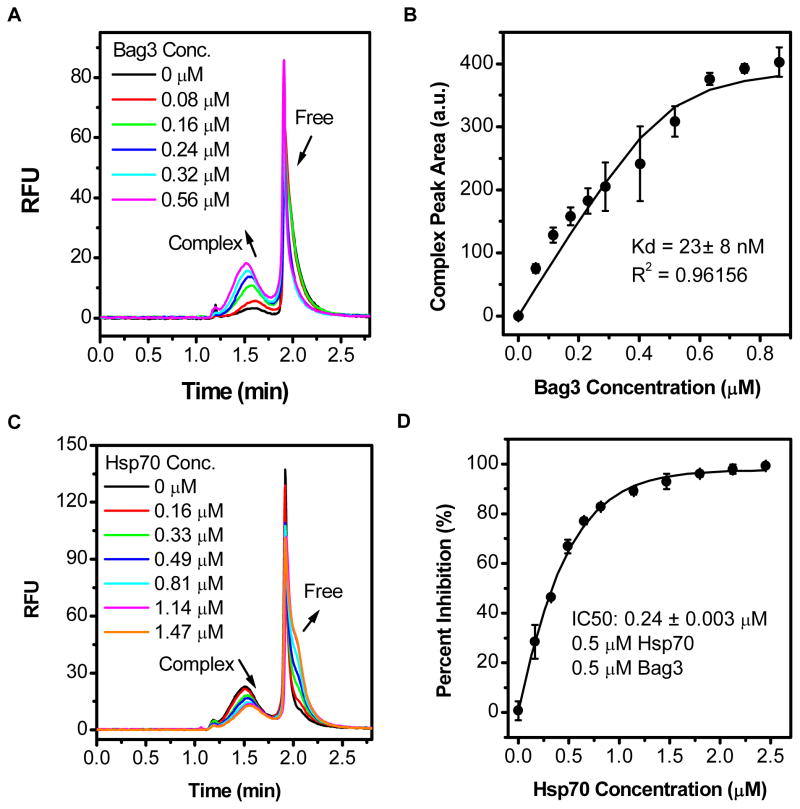
Figure 2.
Determination of dissociation constant (Kd) and IC50 of binding by CE-LIF. (A) Electropherograms of 0.5 μM Hsp70 with increasing concentrations of Bag3; (B) Saturation curve from the titration experiments in Figure 2A by plotting the peak area of complex and dissociation bridge against Bag3 concentration. Non-linear regression determined the Kd to be 23 ± 8 nM. (C) Electropherograms of 0.5 μM Hsp70 and Bag3 with increasing concentration of unlabeled Hsp70. (D) Peak area ratio (bound to free)’s response to increasing Hsp70 concentration. IC50 can be determined for unlabeled Hsp70 to be 0.240 ± 0.003 μM.

