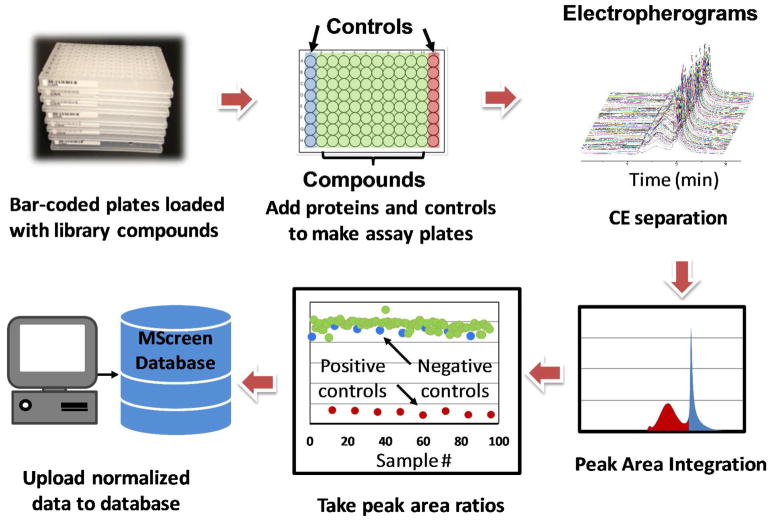
Figure 3.
Illustration of workflow for CE screen. Library compounds were placed in 96 well plates along with controls for assay. After CE separation, peaks were integrated and bound to free ratio for Hsp70–488 measured. Resulting ratios were analyzed to determine those that varied by more than 3 standard deviations from control averages to identify hits.

