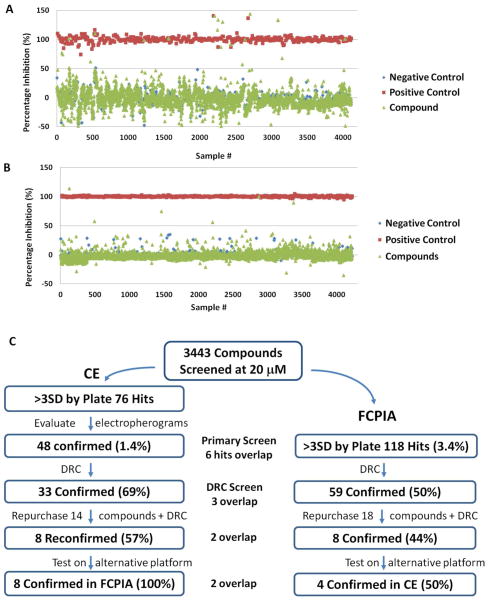
Figure 4.
Results from primary screen of 3,443 compounds using CE and FCPIA. (A) Campaign wide results from CE screen. Negative controls (DMSO) are shown in blue, positive controls (2 μM Hsp70) are shown in red, and compound data points are shown in green. Hits were determined by signal relative to controls on each plate. Z′ score for each plate was calculated and average was 0.58. (B) Campaign wide results from FCPIA screen. Negative controls (DMSO) are shown in blue, positive controls (1 μM Hsp70) are shown in red, and compound wells are shown in green. Average plate Z′ score was 0.86. (C) Summary of triage and confirmation of hits for CE and FCPIA screen.

