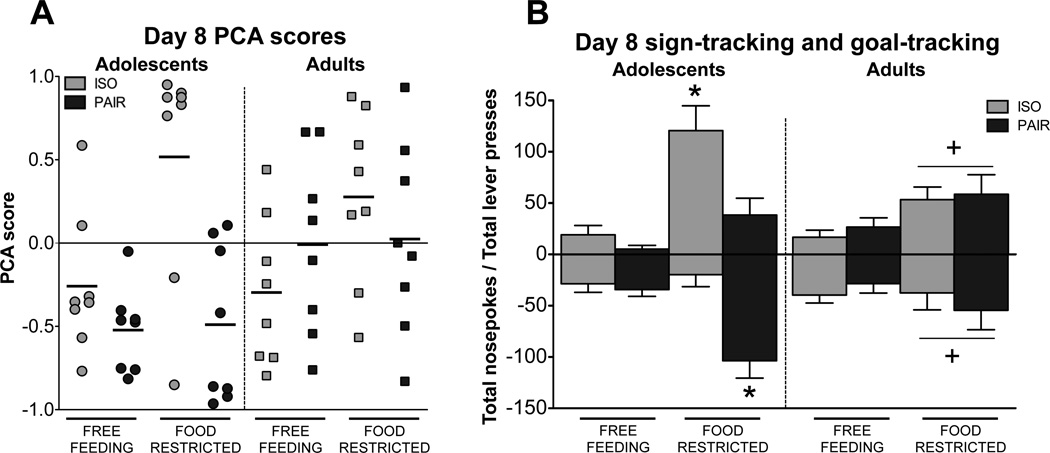
Figure 3.
(A) Individual PCA scores on day 8. Horizontal bars indicate mean PCA score for each group. (B) Lever presses (sign-tracking; positive numbers) and nosepokes (goal-tracking; expressed as negative numbers) for each experimental condition on day 8. Among adolescents, significant differences in total lever presses and nosepokes are indicated by *. For adults, an overall increase in both lever presses and nosepokes in food-restricted relative to free-feeding subjects is indicated by +.

