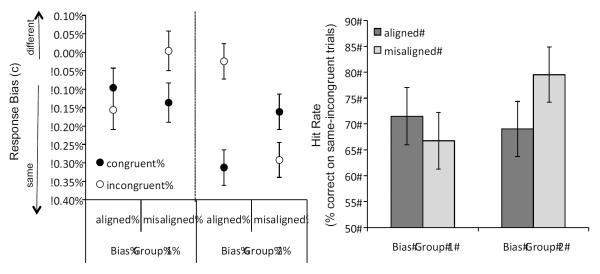
Figure 5.
Left Panel: Response bias (c) on congruent and incongruent trials as a function of alignment for each bias group. Positive values indicate a bias to respond “different” and negative values indicate a bias to respond “same”. Error bars show 95% confidence intervals of the within-subject effects. Right Panel: Hit rate (percent correct on “same”-incongruent trials) as a function of alignment for each bias group. Error bars show 95% confidence intervals of the within-subjects effect.

