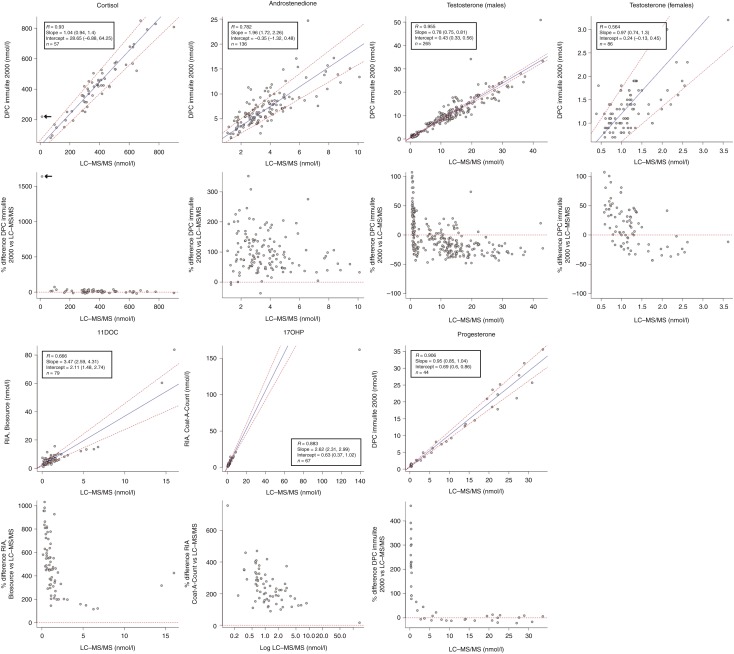
Figure 2.
Comparison of the LC–MS/MS method with immunoassays available at the Hormone Laboratory. Statistical analyses were carried out using the Passing–Bablok regression (upper) and Bland–Altman plots (lower). Arrows in cortisol plots denote a patient put on prednisolone therapy in whom the immunoassay reported falsely elevated cortisol levels (220 vs 12 nmol/l).

