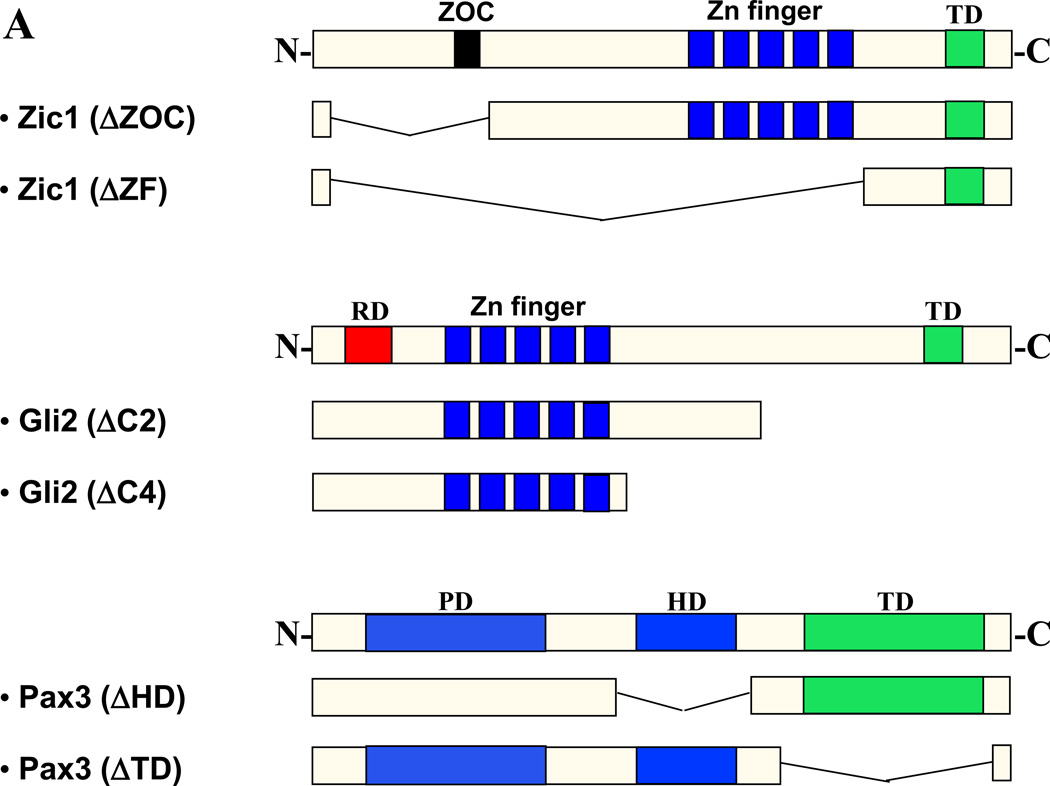
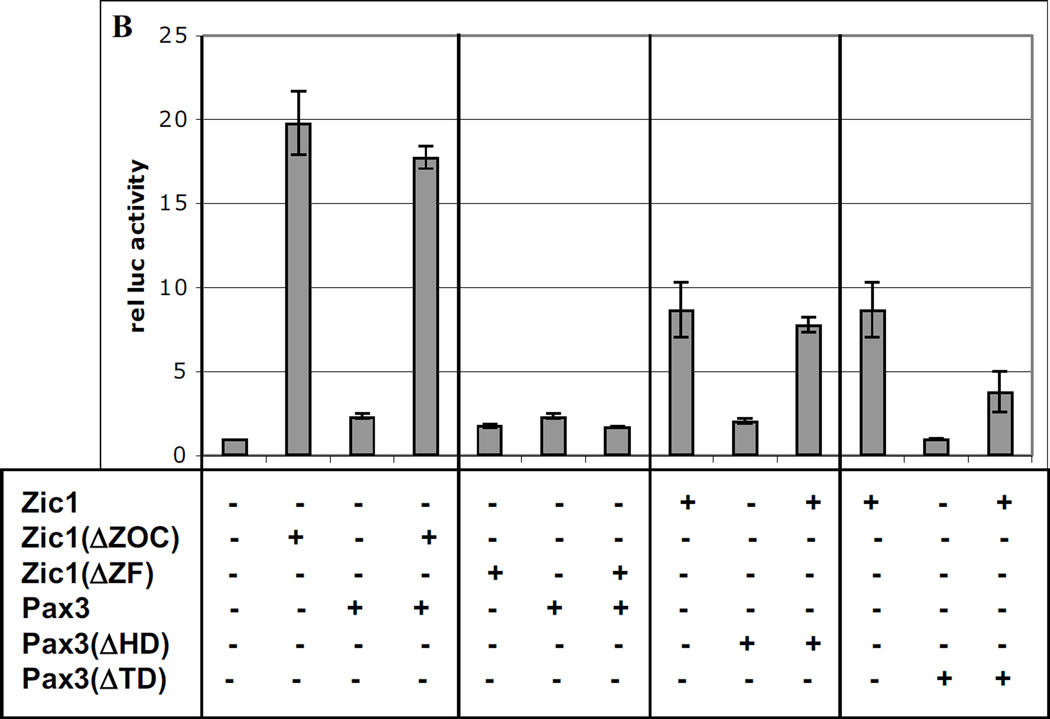
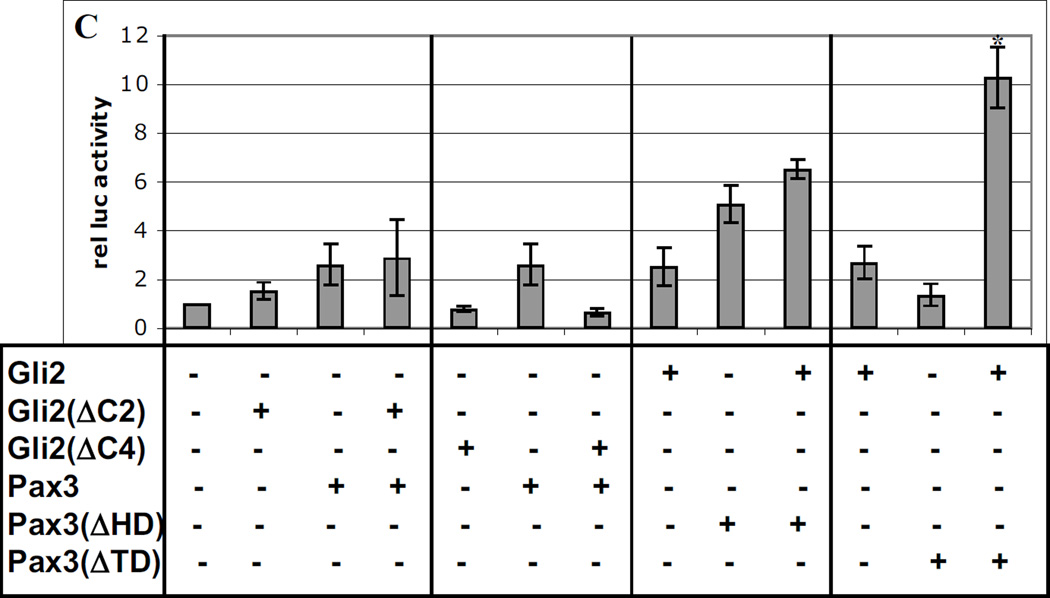
Fig. 3. Conserved regions of Pax3, Gli2, and Zic1 are required for synergy.
A. Diagram of truncations in expression constructs encoding Zic1, Gli2, and Pax3. ZOC = ZOC motif; ZF = zinc finger domain; HD = homeodomain; TD = transactivation domain; C2 & C4 = C terminal domains. B–C. Truncated constructs in A were tested for synergy in transactivating the Myf5 ES enhancer and promoter as in Fig 1–2. Asterisk in C indicates synergy (p = 0.01) between Gli2 and Pax3(ΔTD) (one-tailed, one-step t-test comparing activity of factors in combination to the sum of individual factors).


