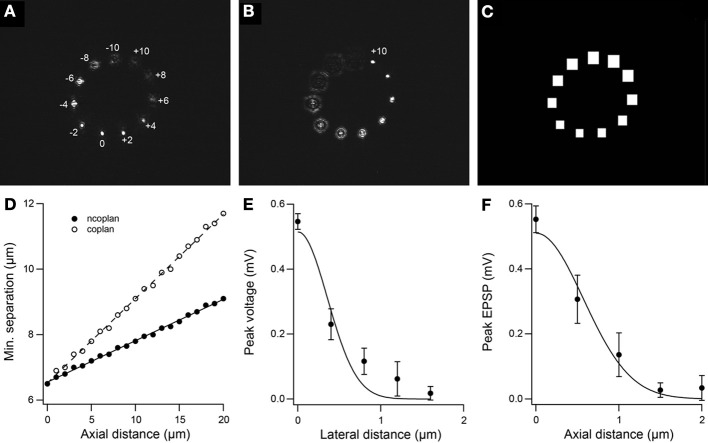
Figure 3.
Spatial resolution of independent gating and uncaging. (A) 3D photostimulation pattern with objective lens focused in the reference plane z = 0 μm and the other 10 sites holographically projected either above (negative) or below (positive) the reference plane. (B) Same photostimulation pattern as in C but with objective lens focused in the plane z = +10 μm. (C) Sizes of micro-mirror arrays for switching foci shown in A. The array size scales with distance from the objective focal plane allowing collection of out-of-focus light. (D) Minimum separation for independent gating of two uncaging sites as a function of axial distance for the case when one spot is fixed while the other spot is moved away axially (ncoplan) and for when both spots move together in the axial direction (coplan). DMD array size is 15. Solid line is linear fit. (E) Peak voltage with varying lateral distance orthogonal to a spine. FWHM =0.8 ± 0.1 μm. (F) Peak voltage as a function of axial distance above the spine. FWHM = 1.3 ± 0.1 μm. For E and F, solid lines are Gaussian fits.

