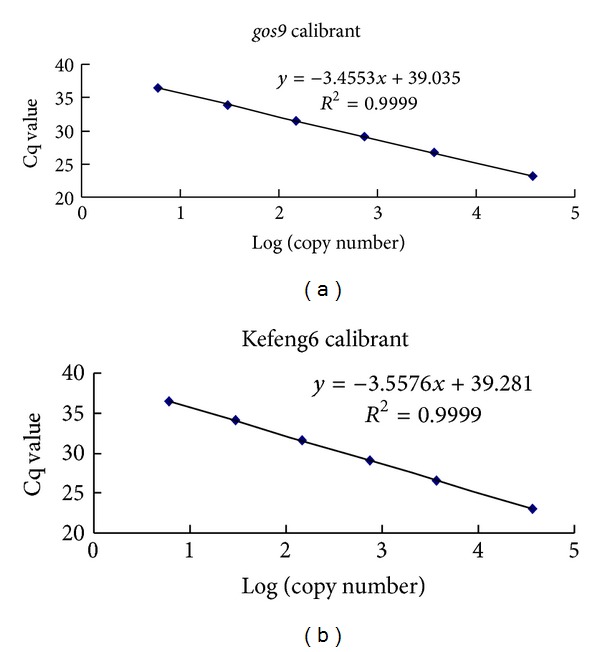
Figure 2.

Calibration curves. Sample calibration curves associated with the estimations of the endogenous copy number ((a), gos9) and the transgenic copy number ((b), Kefeng6). The x-axis represents the logarithm of the estimated copy number of the calibrant, and the y-axis represents the Cq value.
