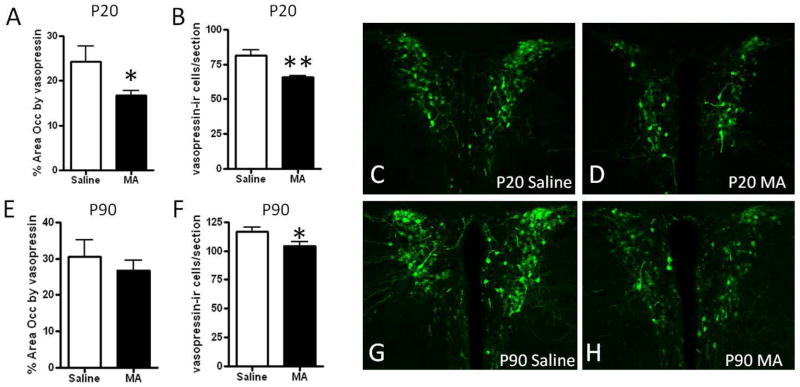
Figure 2. Vasopressin immunoreactivity in the paraventricular nucleus following postnatal MA treatment.
(A) The number of vasopressin-immunoreactive cells and (B) area occupied by vasopressin immunoreactivity was decreased in the PVN of P20 mice treated with MA from P11–20 compared to Saline controls. At P90 (E) the number of vasopressin- immunoreactive cells was still decreased following MA treatment, but the area occupied by vasopressin immunoreactivity did not significantly differ between treatment groups (F). Representative images of vasopressin immunoreactivity in the PVN are shown in (C–D, G–H). Images were captured using a 10x objective. Each bar represents the mean +/− SEM. * indicates p<.05, ** indicates p<.01 compared to Saline treatment.

