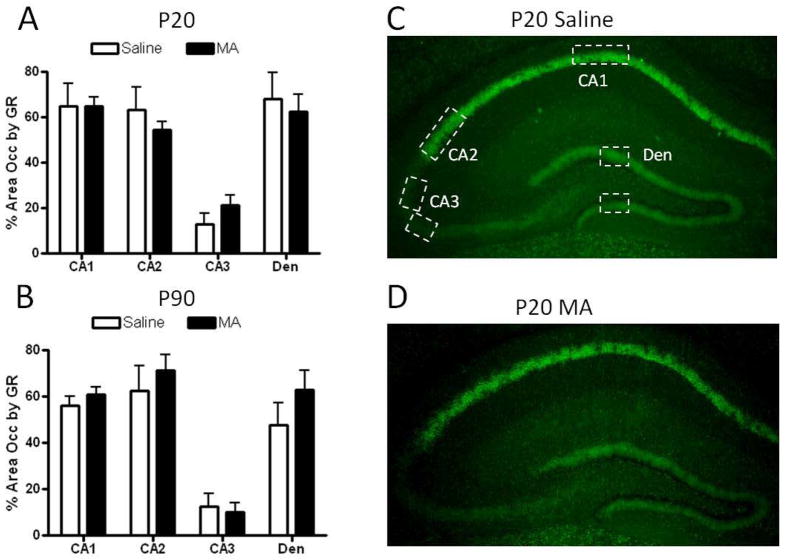
Figure 5. GR immunoreactivity in the hippocampus following postnatal MA treatment.
The area occupied by GR immunoreactivity was not significantly altered by MA treatment in any region of the hippocampus at P20 (A) or P90 (B). Representative images of GR immunoreactivity in the P20 hippocampus are shown in (C–D). Boxes indicate areas within which GR immunoreactivity was quantified. Images were captured using a 4x objective. Each bar represents the mean +/− SEM. Den, dentate gyrus.

