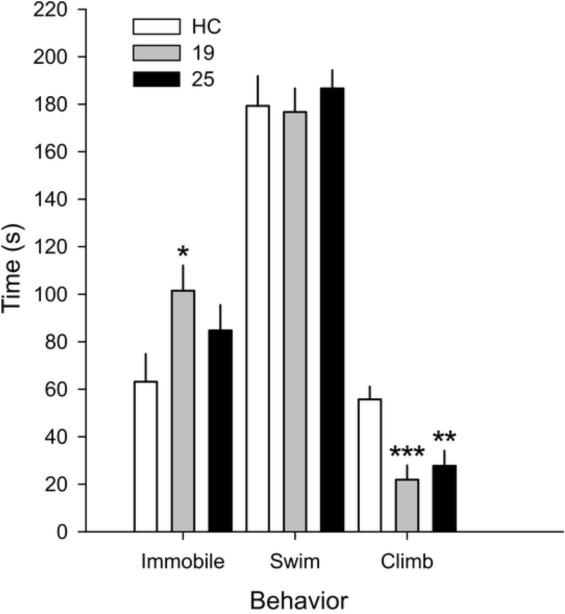
Figure 4.
Graph illustrating the effects of Days 1 and 2 swim stress on behavior. Graph displaying the effects of home cage (HC) control conditions or 15 minute swim stress at 19 °C or 25 °C on Day 1 on subsequent behavior following exposure to swim stress at 25 °C on Day 2. Behavior was measured continuously and is expressed as mean total time +SEM. * p < 0.05 vs HC, ** p < 0.01 vs HC, *** p < 0.001 vs HC; Fisher’s protected least significant difference (LSD) test. HC, n = 9; 19 °C, n = 8; 25 °C, n = 7.

