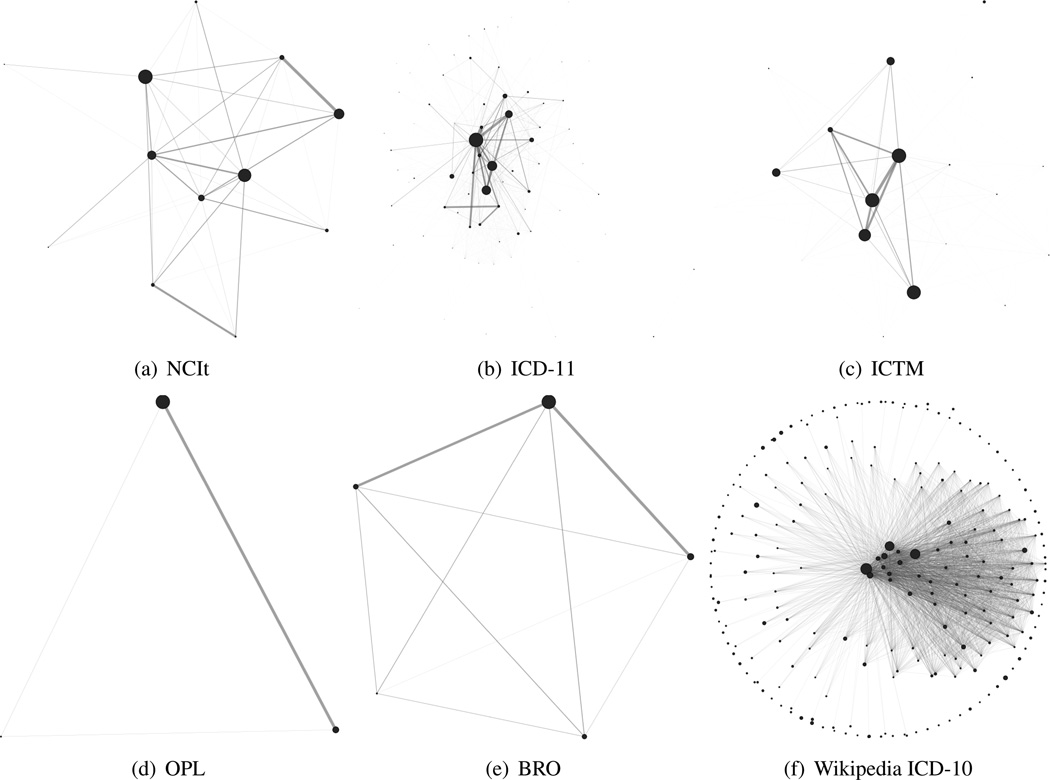
Figure 8.
Collaboration graphs for all data sets. Nodes represent users who collaborated with at least one other user on at least one concept within our observation period. The node size represents the amount of changes and annotations performed by the user while edge weights represent the amount of co-editing/collaboration between two users. In the following, we estimate the extent of collaboration in our data sets by calculating a collaboration ratio, i.e. the number of users who have annotated or changed at least one common concept with another user, divided by the total number of registered users. Thus the extent of collaboration is 100% in NCIt (12/12), 97.37% in ICD-11 (74/76), 90.48% in ICTM (19/21), 83.33% in BRO (5/6) and 60% in OPL (3/5). The Wikipedia ICD-10 graph shows nodes for all 231 registered users who performed at least 300 changes, and edges between users who have mutually edited at least 100 common pages. Collaboration has been defined as two users who have performed at least 1 change on the same concept for ontology data sets and 100 for the wikipedia data set. Due to the nature of this definition, the most active users are also the most central users, however it can be observed that rather high degrees of collaboration (based on edge weights) also occur between smaller nodes (cf. NCIt, ICD-11 and Wikipedia ICD-10).

