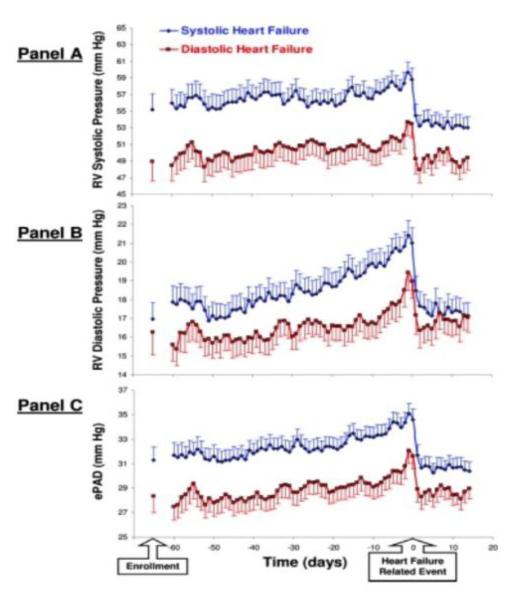
Figure 2. Daily implantable hemodynamic monitor-derived pressures in heart failure patients.
Trends in daily median implantable monitor-derived pressures are shown beginning 60 days before a hypervolemic HF-related event and continuing for 14 days after. Open blue circles represent low ejection fraction and closed red squares preserved ejection fraction HF patients. Right ventricular systolic pressure (A) and diastolic pressure (B), and an estimate of pulmonary artery diastolic pressure (C), are shown. In both group of patients, an increase was found preceding the event in all 3 pressures, which returned to baseline after treatment.
With permission, Zile et al. Circulation. 2008;118:1433-1441

