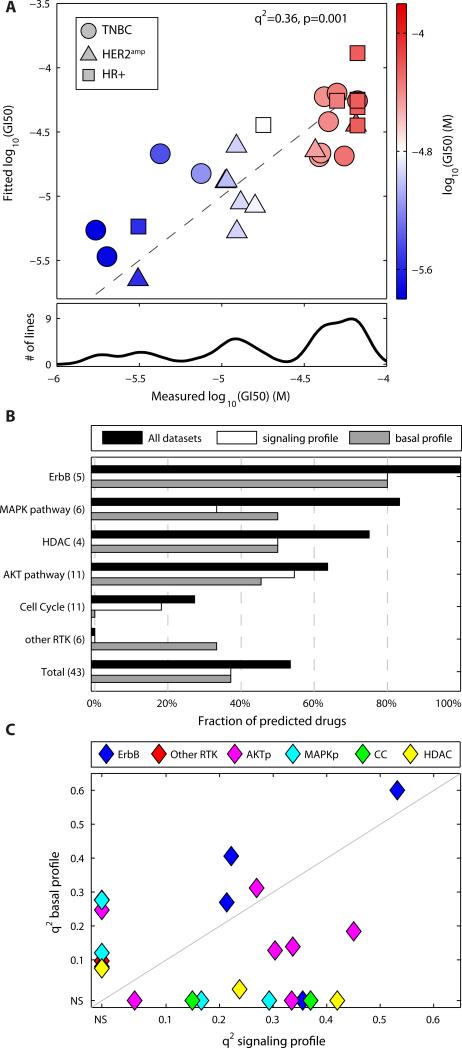
Fig. 3. Basal profiles and signaling profiles predict responses to targeted inhibitors.
(A) Projection of the fit of the PLSR model based on the signaling profile data predicting GI50 values for erlotinib responses against the measured response for each cell line (red, resistant; blue, sensitive). Lower plot shows the trimodal distribution of the measured GI50 values across the cell lines. (B) Fraction of drugs for each class (see Table 1) predicted by the totality of the data (black), the signaling profile based on the maximal response to the 15 growth factors (white), and the basal profile (gray). (C) Distribution of the q2 for drugs significantly predicted by the basal or signaling profile grouped by primary drug targets (AKTp, AKT pathway; MAPKp, MAPK pathway; CC, cell cycle). Non-significant predictions (NS) are set to zero. Colors represent different classes of drugs.

