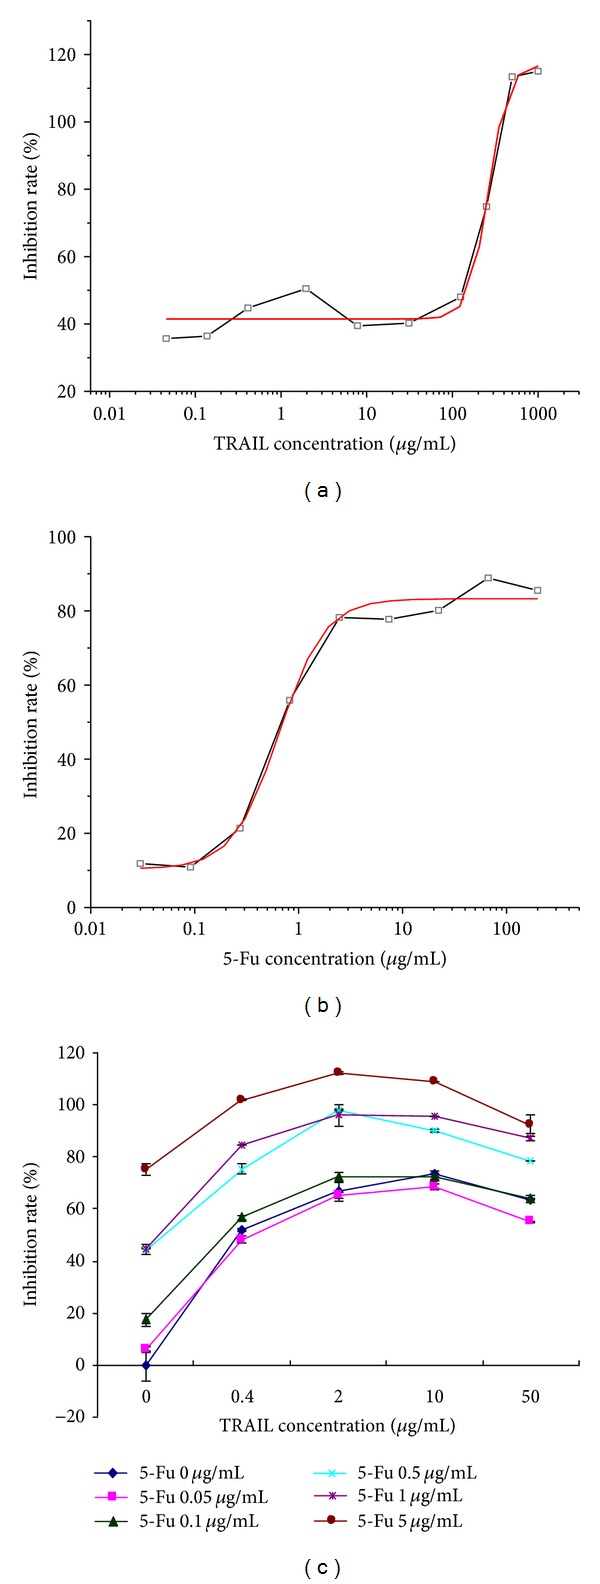
Figure 1.

SRB assay. (a) TRAIL treatment; (b) 5-Fu treatment; and (c) combination treatment. The dose response curves were depicted applying OriginPro 7.5 software (R 2 = 0.979 for TRAIL; R 2 = 0.992 for 5-Fu). There was significant positive correlation between cell inhibitive rate and TRAIL concentration between 0 μg/mL and 1000 μg/mL (r = 0.921, P < 0.01). IC50 was 261.60 ± 23.38 μg/mL which was larger than 10 μg/mL suggesting that AGS cells were relatively resistant to TRAIL. There was significant positive correlation between cell inhibitive rate and 5-Fu concentration between 0 μg/mL and 100 μg/mL (r = 0.735, P < 0.05). IC50 was 0.646 ± 0.078 which was lower than 10 μg/mL suggesting that AGS cells were sensitive to 5-Fu.
