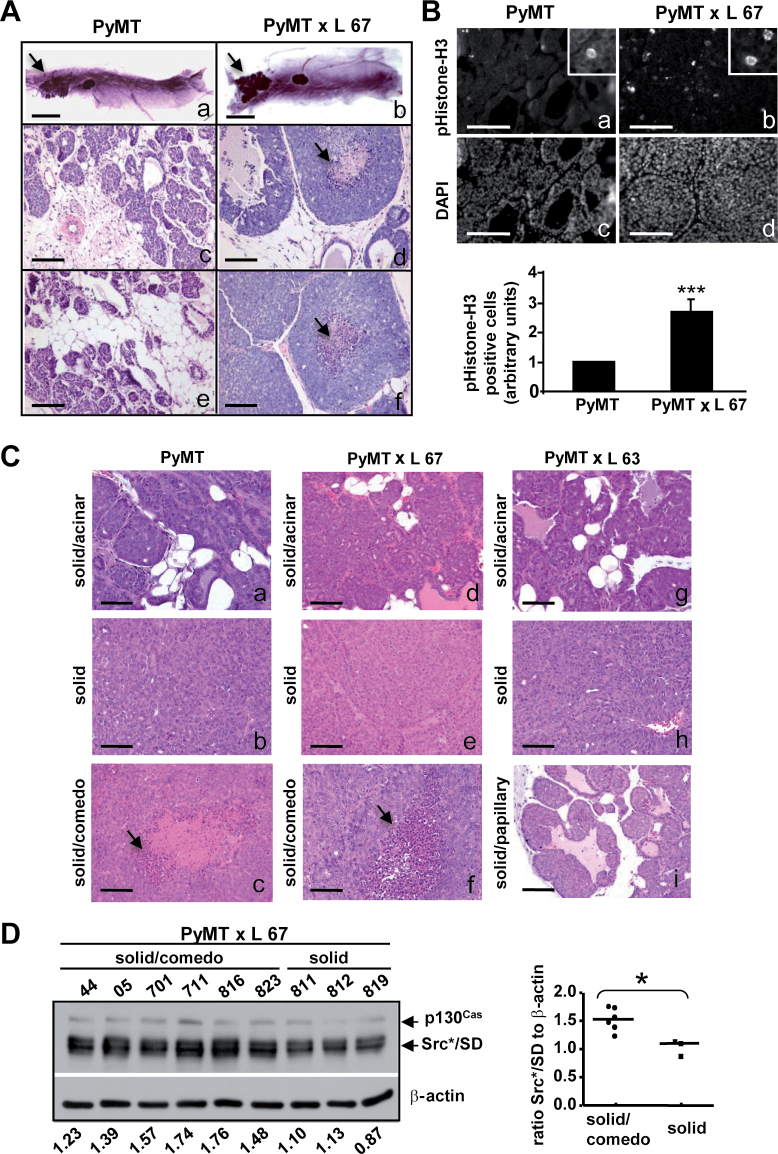
Fig. 3.
Comparison of tumor development in PyMT and PyMT × Src*/SD animals. (A) Whole-mount inguinal mammary glands isolated from 4-week-old PyMT and PyMT × Src*/SD (L 67) mice (a and b). Arrows indicate lesions. Hematoxylin and eosin-stained mammary gland tumor sections (c–f). Scale bars: 5mm (a and b) and 100 μm (c–f). (B) Nuclei of mammary gland tumors from 4-week-old PyMT and PyMT × Src*/SD (L 67) mice labeled by immunofluorescence for mitotic marker pHistone-H3 (a and b) and with DAPI (c and d). Insets show enlarged areas with stained cells. Scale bar: 100 μm (a–d). Quantification of tumor cells stained positive for pHistone-H3 (pH3; lower panel). ***P ≤ 0.001. (C and D) Mammary gland tumors were harvested at ~1cm in the largest dimension from PyMT and PyMT × Src*/SD (L 67 and L 63) mice. (C) Representative histological patterns of solid/acinar (panels a, d and g), solid (panels b, e and h), solid/comedo (panels c and f) and solid/papillary (panel i) identified for each line are shown. Arrows indicate necrotic core. Scale bar: 100 μm. (D) Src*/SD expression is higher in mammary gland tumors with comedo-type histology. Left panel, WCE (20 μg) were analyzed by IB with CasB and β-actin antibodies (loading control). Relative levels of Src*/SD for each tumor are listed on the bottom of the lanes. Right panel, comparison of Src*/SD levels in solid/comedo tumors versus solid tumors. *P ≤ 0.05.

