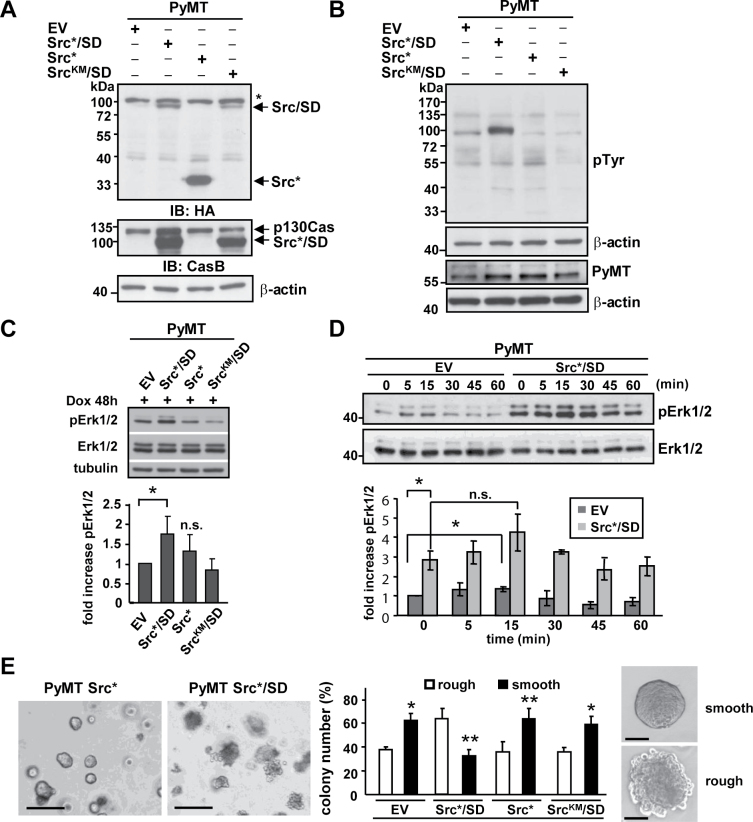
Fig. 4.
Src*/SD expression in PyMT-derived mammary tumor cells increases Erk1/2 activity. (A–E) Expression of Src*/SD and control plasmids (Src*, SrcKM/SD and EV) was induced in PyMT breast cancer cells with Dox (2 μg/ml) for 48h (A–D) and 10 days (E). (A) Expression of the individual constructs was determined by IB with HA and CasB antibodies. *, non-specific band. β-actin antibodies were used as loading control. (B) WCE was monitored for tyrosine phosphorylation of total cellular proteins with pTyr and β-actin antibodies, and for the expression of PyMT with PyMT and β-actin antibodies. (C) Upper panel, phosphorylation of Erk1/2 was analyzed by IB in WCE (20 μg) of PyMT cells expressing the indicated constructs. Total ERK1/2 and tubulin antibodies were used as controls. Lower panel, the fold increase in pErk1/2 was determined by densitometric analysis of three independent experiments. n.s., not significant; *P ≤ 0.05. (D) Dox-inducible PyMT-Src*/SD and PyMT-EV stable cell populations were starved in medium containing 0.5% FBS for 24h and subsequently stimulated with 20% FBS for the indicated times. Upper panel, WCE (20 μg) were analyzed by IB with pERK1/2 and ERK1/2 antibodies. Lower panel, fold increase in pErk1/2 was determined as described previously. Data represent ±standard deviation of duplicate of three independent experiments. (E) Cell populations were subjected to matrigel assay, and colony formation was observed for 10 days. Scale bar: left panel, 300 μm; right panel 50 μm. Colony appearance for Src*/SD and EV cells is depicted. Relative numbers of colonies with rough versus smooth boundaries are given for each cell population. Black bars, colonies with smooth boundaries; white bars, colonies with rough boundaries. Data represent ±standard deviation of duplicate of three independent experiments. *P < 0.05. **P < 0.01.

