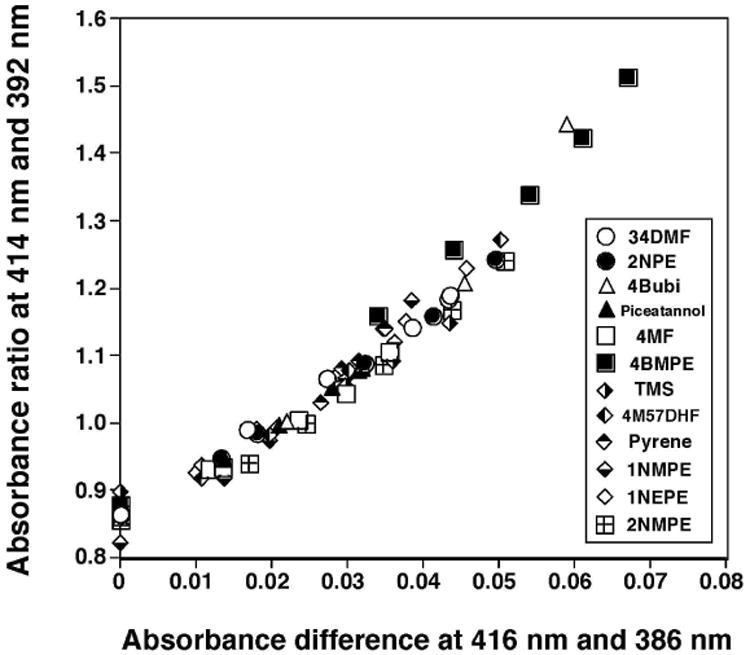
Figure 5.

Correlation between the peak ratio of 414 nm vs 392 nm in the absolute spectra of P450 and the absorbance difference in 416 nm and 386 nm in the difference spectra for 12 chemical inhibitors. Methods for determination of the spectra are presented in Experimental Procedures. Concentrations of chemicals used were 12.5-100 μM except for TMS, 4M57DHF, and pyrene, for which concentrations of 1.25-10 μM were used.
