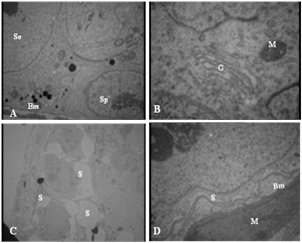
Figure 2.

Electronmicrograph of seminiferous tubule in mice: control group (A, B) and experimental group (D, C). A) Spermatogonia (Sp) and sertoli cells (Se) on basement membrane (Bm), 3097 X. B) mitochondria (M) and Golgi (G), 12930 X. C) Note separation of cells from each other (s). D) Sertoli cell is separated from basement membrane (S). The basement membrane is wavey (Bm). A contracted myoid cell is shown in the figure (M). 3097 X.
