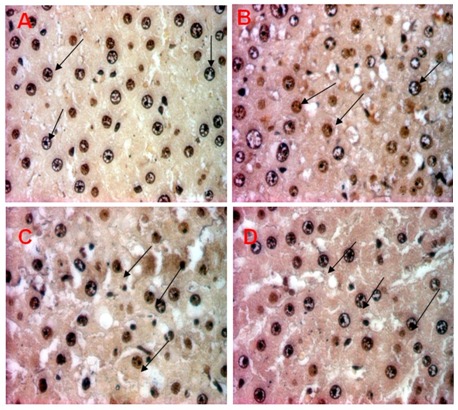
Figure 7.

AgNO3 stained liver tissues of control and experimental group.
Rats were divided into 4 groups, (A) 0.5 % CMC-Na, (B) DMBA control group (20 mg/kgbW in CMC-Na), (C) DMBA+ 300 mg/kgBW EGP; (D) DMBA+750 mg/kgbw EGP. At autopsy, liver organ were removed and fixed in 10% buffered formalin. 3-5 μm tissue slices were embedded in paraffin, and stained with AgNO3. Argyrophilic nucleolar organiser regions (AgNORs) are visible as dark dots within the plasma cell nuclei (pointed by black arrow). Magnification x1000.
