
Figure 1.
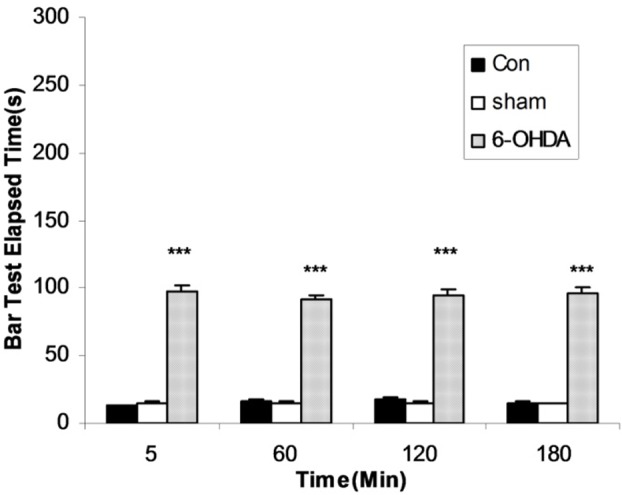
The results of bar test in control, Sham-operated and 6-OHDA (8μg/2μl/rat)-lesioned rats. Each bar represents the mean±SEM of elapsed time (s), n = 8 rats for each group; *** p<0.001 when compared with normal (Con) and sham operated groups.