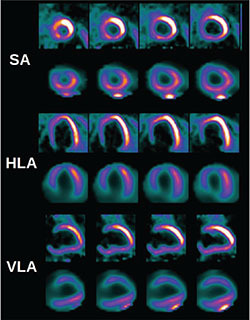
Figure 2.
Comparison of myocardial glucose metabolism (18F-FDG PET) and myocardial perfusion (99mTc-tetrofosmin SPECT). Myocardial metabolism is shown in the top row and myocardial perfusion in the bottom row in each axis. Presence of myocardial metabolism in areas of reduced myocardial perfusion in the anterior wall signifies areas of hibernating myocardium. SA: short axis; HLA: horizontal long axis; VLA: vertical long axis.