
Figure 4.
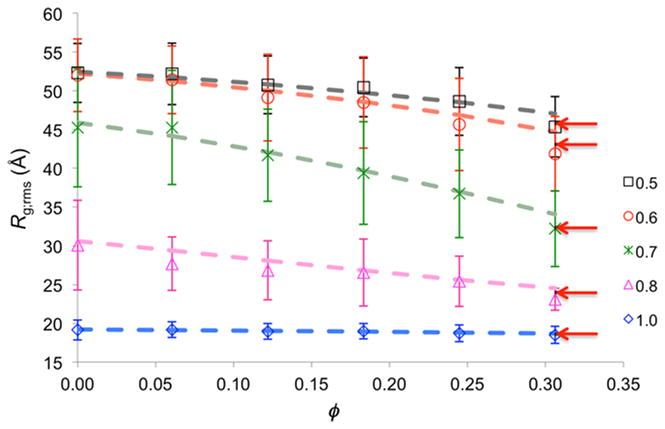
Rg;rms values obtained from direct simulations (symbols with error bars representing standard deviations among 36 repeat trajectories) and predicted by the postprocessing approach, with Δμ calculated either by approximating the crowders as hard spheres (dashed curves) or by exact treatment of the inverse r12 form of protein-crowder interactions (red arrows at ø = 0.31).