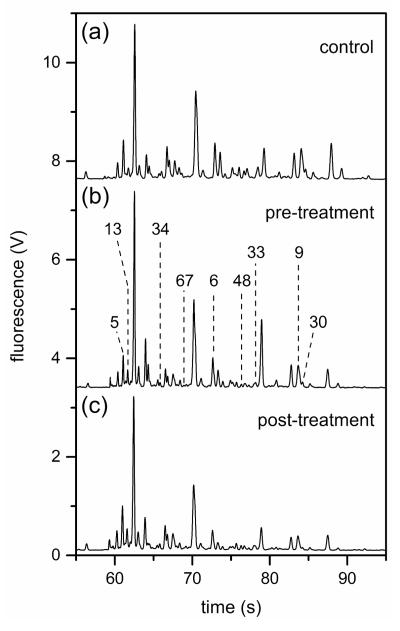
Figure 2.
Electropherograms of the N-glycans derived from blood serum samples from (a) a control individual and (b)–(c) ovarian cancer patients prior to (pre-treatment) and after (post-treatment) an experimental drug treatment. N-Glycan peaks with migration times from 55 to 100 s were used for the disease-state analysis, and the labeled peaks contributed significantly to the differentiation of sample groups. Peak numbers were assigned relative to the peak areas from a reference electropherogram from a pre-treatment sample. Separation performance was evaluated with peaks at 62.1, 72.2, 76.3, and 87.0 s. The separation channel was 22 cm long and was operated at 1250 V/cm.

