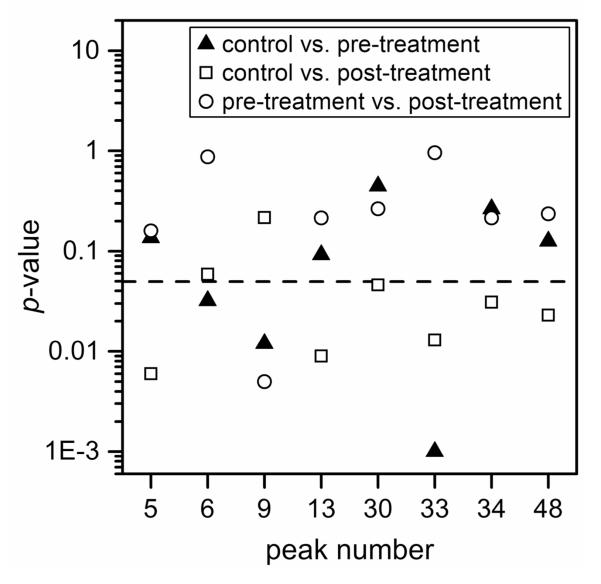
Figure 4.
p-values of N-glycan peaks from the analysis of variance (ANOVA) tests for pairwise comparisons of the control and pre-treatment samples, control and post-treatment samples, and pre-treatment and post-treatment samples. The dashed line indicates a p-value of 0.05. At least one pair-wise comparison for each peak has a p-value <0.05.

