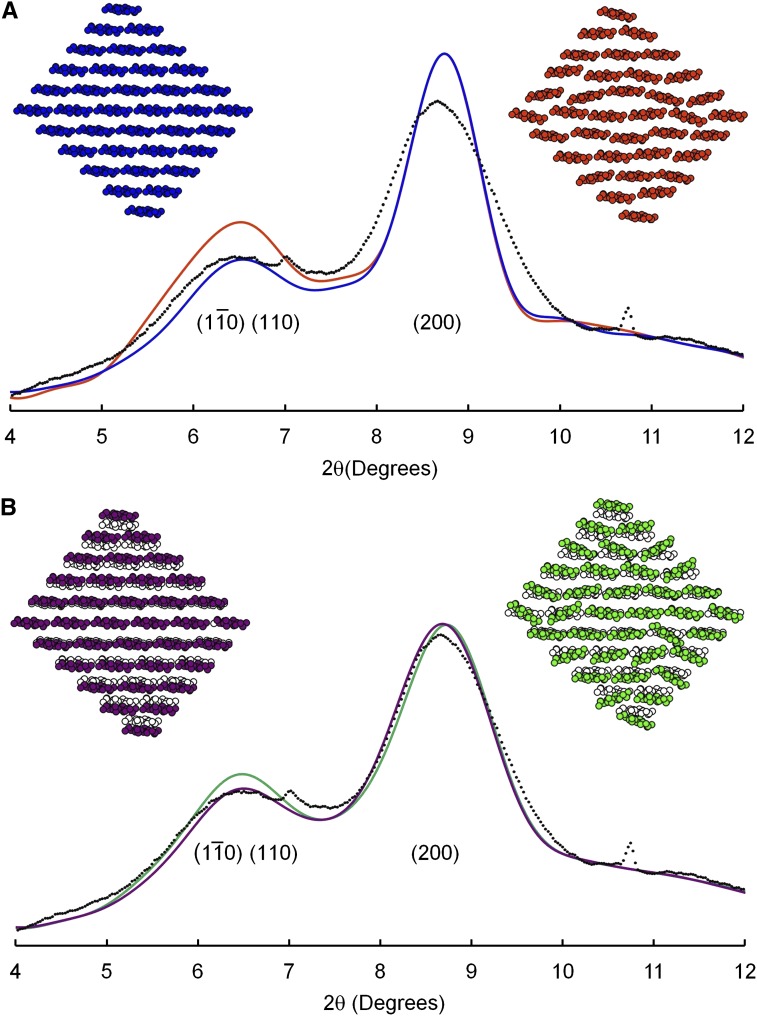
Figure 3.
WAXS diffractogram of mung bean cell walls (dots) after subtraction of the diffractogram of adhesive tape, for radiation of wavelength 0.06199 nm, and diffractograms calculated for a 36-chain microfibril model without disorder (blue) and with type 1 disorder (orange; A) and two models with type 2 disorder as described in the text (purple and green; B).

