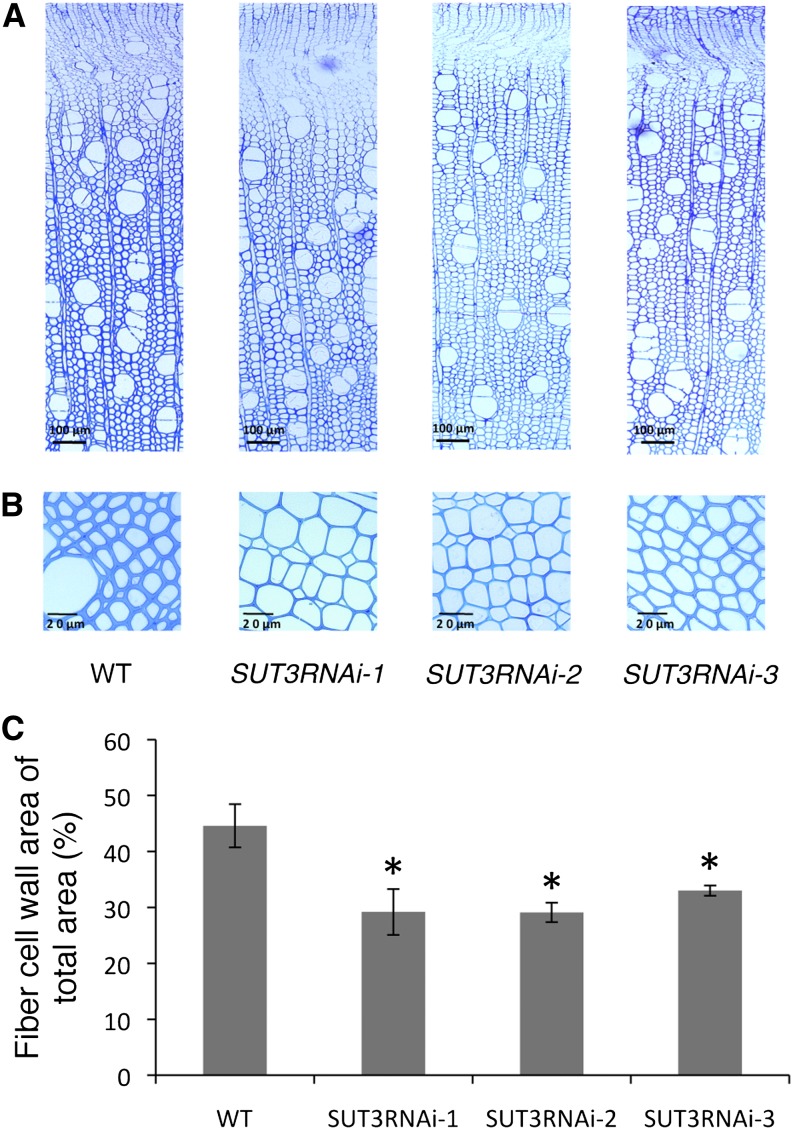
Figure 5.
Wood anatomy and fiber wall area in the wild type (WT) and SUT3RNAi lines. A and B, Light microscopy images of representative stem sections. C, Fiber cell wall area of mature xylem fiber cells. Error bars represent se of four biological replicates. Asterisks indicate P value comparison with the wild type: *P < 0.05 (Student’s t test). [See online article for color version of this figure.]

