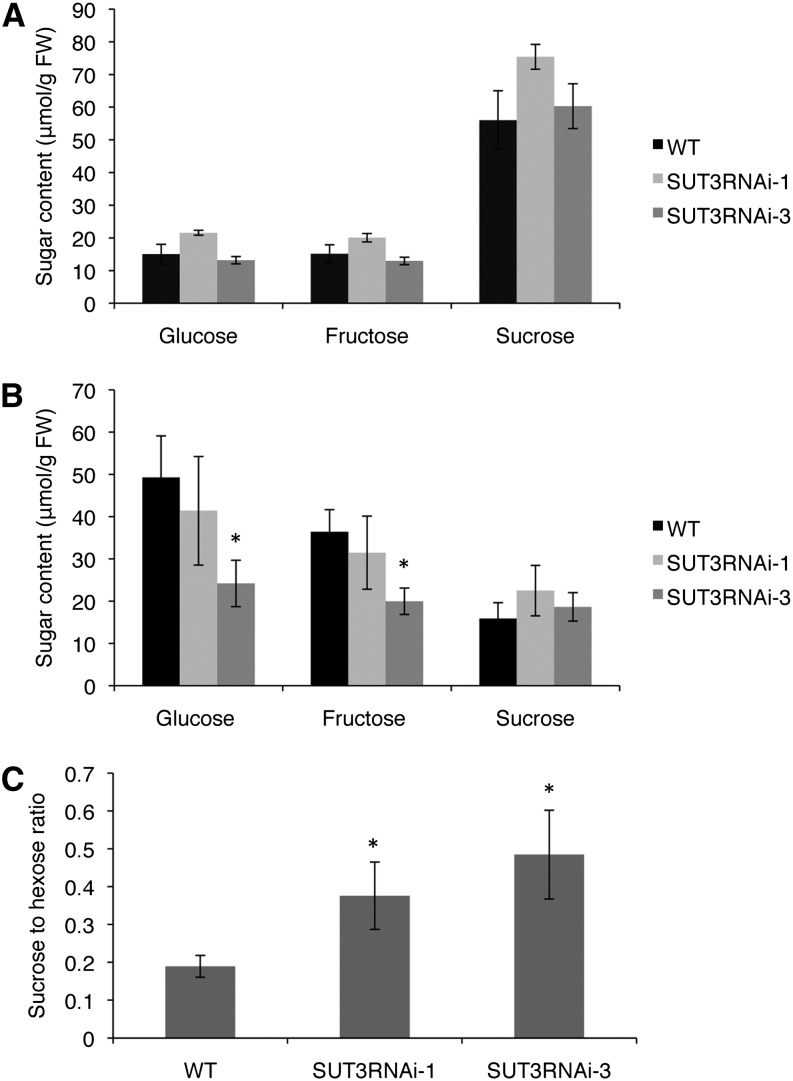
Figure 8.
A and B, Analysis of Suc, Glc, and Fru content in phloem (A) and in developing wood (B) of the wild type (WT) and SUT3RNAi lines. FW, Fresh weight. C, Suc-to-hexose ratio in developing wood. Error bars represent se of four biological replicates. Asterisks indicate P value comparison with the wild type: *P < 0.05 (Student’s t test).

