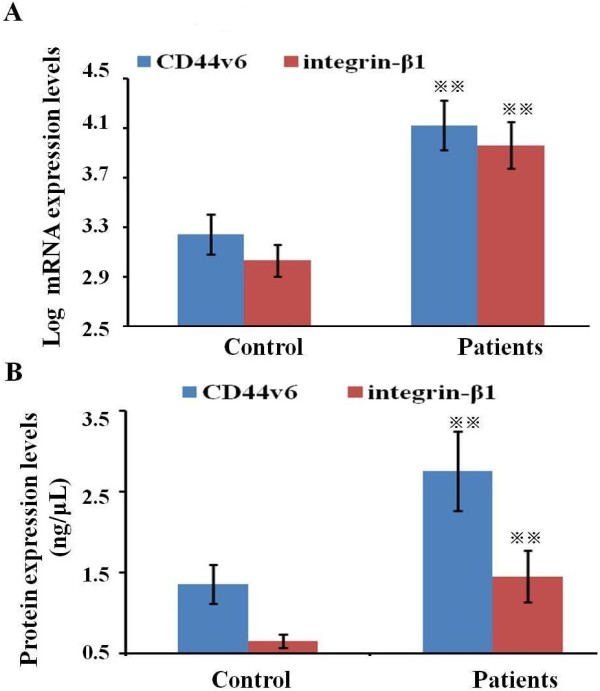
Figure 1.

The comparison of CD44v6 and integrin-β1 expression levels between patients and control. (A) CD44v6 and integrin-β1 mRNA expression levels in PBMC of patients and control were determined by the triplex quantitative RT-PCR. (B) CD44v6 and integrin-β1 protein expression levels in plasma of patients and control were determined by the quantitative ELISA. Notes: Bars indicate standard error and ※※ symbols indicate the statistical difference between patients and control (※※p<0.01).
