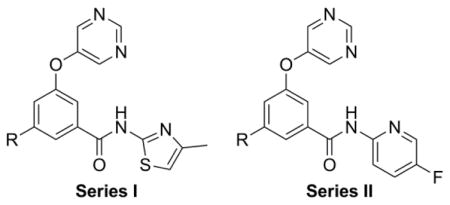
Table 3.
Phenyl Ring SAR

| |||||
|---|---|---|---|---|---|
| cpd | Series | R | mGlu5 pIC50 (± SEM)a | mGlu5 IC50 (nM) | % Glu Max (± SEM)a,b |
| 23 | I | H | 6.69 ± 0.25 | 205 | 1.7 ± 0.3 |
| 24 | I | F | 7.62 ± 0.03 | 24 | 1.2 ± 0.1 |
| 25 | I | Cl | 7.94 ± 0.19 | 11 | 1.4 ± 0.2 |
| 26 | I | CF3 | 6.55 ± 0.10 | 283 | 1.7 ± 0.2 |
| 27 | II | F | 6.52 ± 0.07 | 305 | 1.3 ± 0.3 |
| 28 | II | Cl | 7.49 ± 0.02 | 33 | 1.2 ± 0.2 |
| 29 | II | CH3 | 7.72 ± 0.06 | 19 | 0.8 ± 0.2 |
| 30 | II | CF3 | 5.26 ± 0.01 | 5530 | 3.2 ± 0.3 |
| 31 | II | CN | 6.50 ± 0.08 | 318 | 1.1 ± 0.4 |
Calcium mobilization mGlu5 assay; values are average of n ≥ 3
Amplitude of response in the presence of 30 μM test compound as a percentage of maximal response (100 μM glutamate); average of n ≥ 3
