Figure 6.
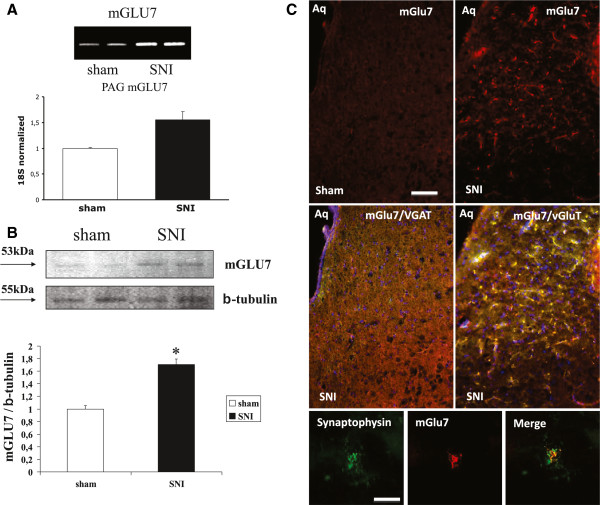
Expression of mGluR7 mRNA in the VL PAG: RT-PCR analysis starting from 100ng mRNA shows an increase for mGluR7 gene expression in SNI rats compared to sham rats. Quantification of the expression levels is reported in the graphic that shows RT-PCR data value for mGluR7 relative to the housekeeping 18S gene and normalized with respect to the mean of the shams (A). Western blot analysis for mGluR7 protein in PAG lysate from SNI and sham rats normalized with respect to β-tubulin and sham mean (B). Expression of mGluR7 in the PAG of SNI and sham rats. Double staining shows the high expression of mGluR7 on vGluT positive terminals (right) and low expression on VGAT positive terminals (left). Wave length is 568 nm for red staining and 488 for green staining (not shown) the merge was performed of 488 and 568 channels (yellow). Lowest panel indicate the double staining mGluR7 (red) synaptophysin (green) and relative merge (C). Purple spots indicate a DAPI and red background/fluorescence spot overlapping. Scale bar = 100 μm. Data are represented as a mean ± SEM. p < 0.05 was considered statistically significant.

