Fig. 1.
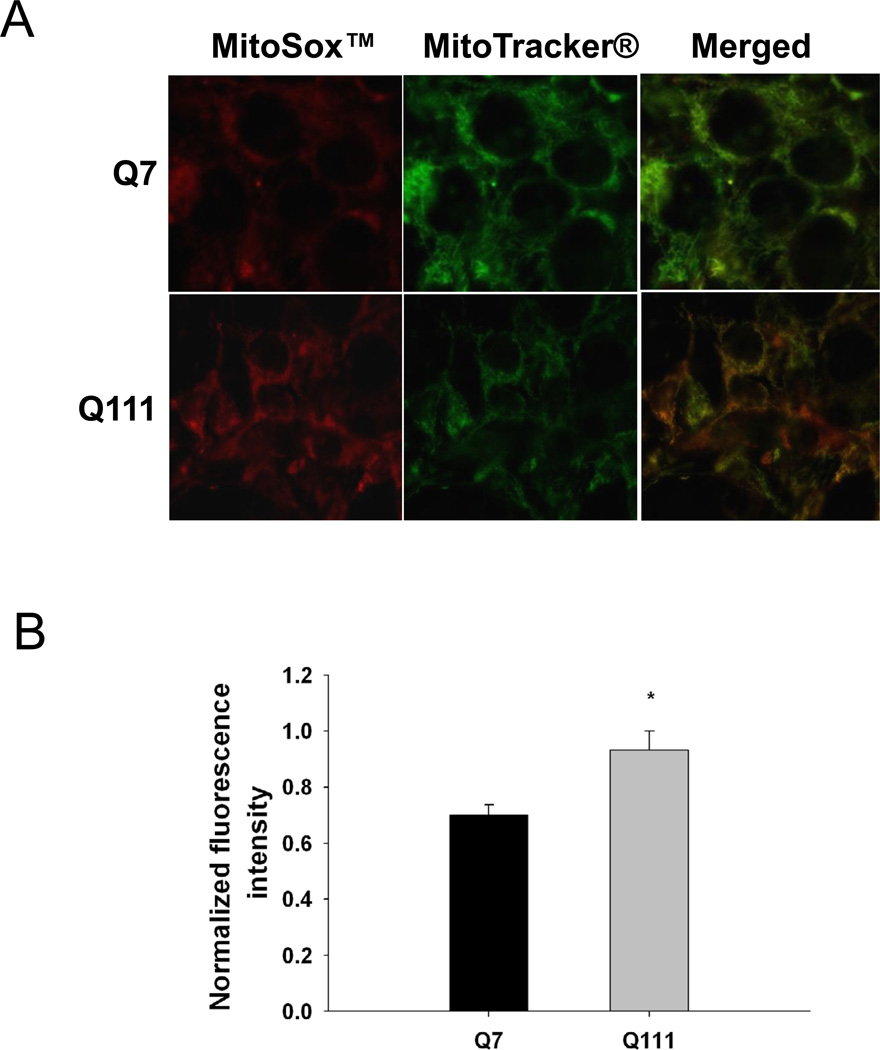
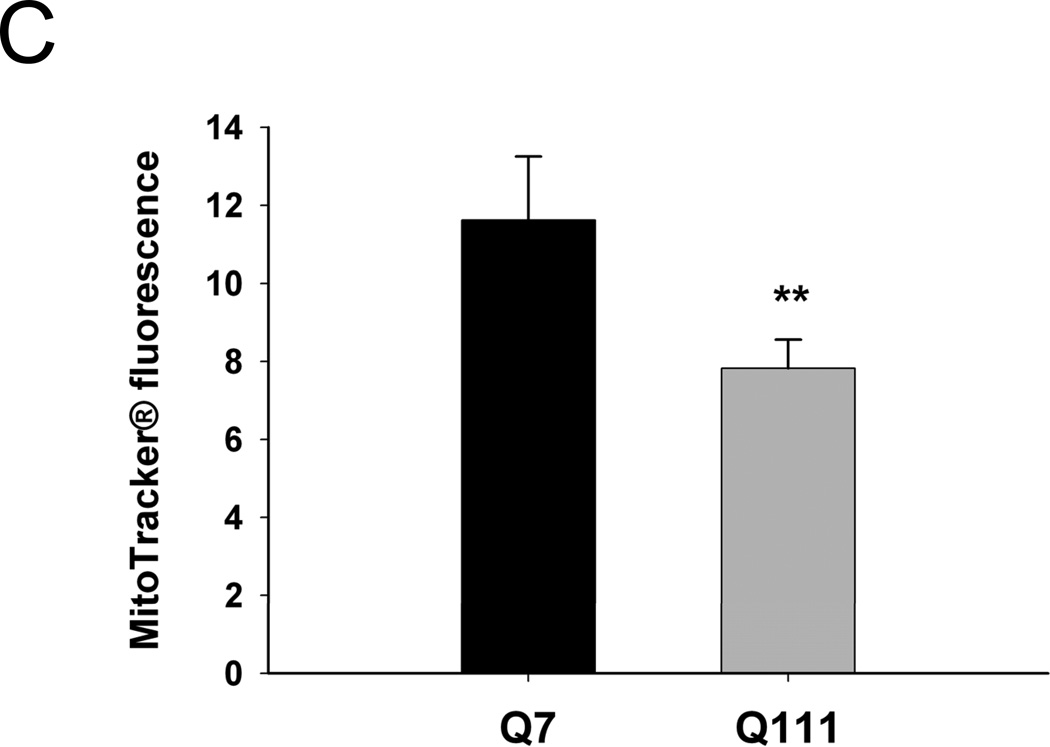
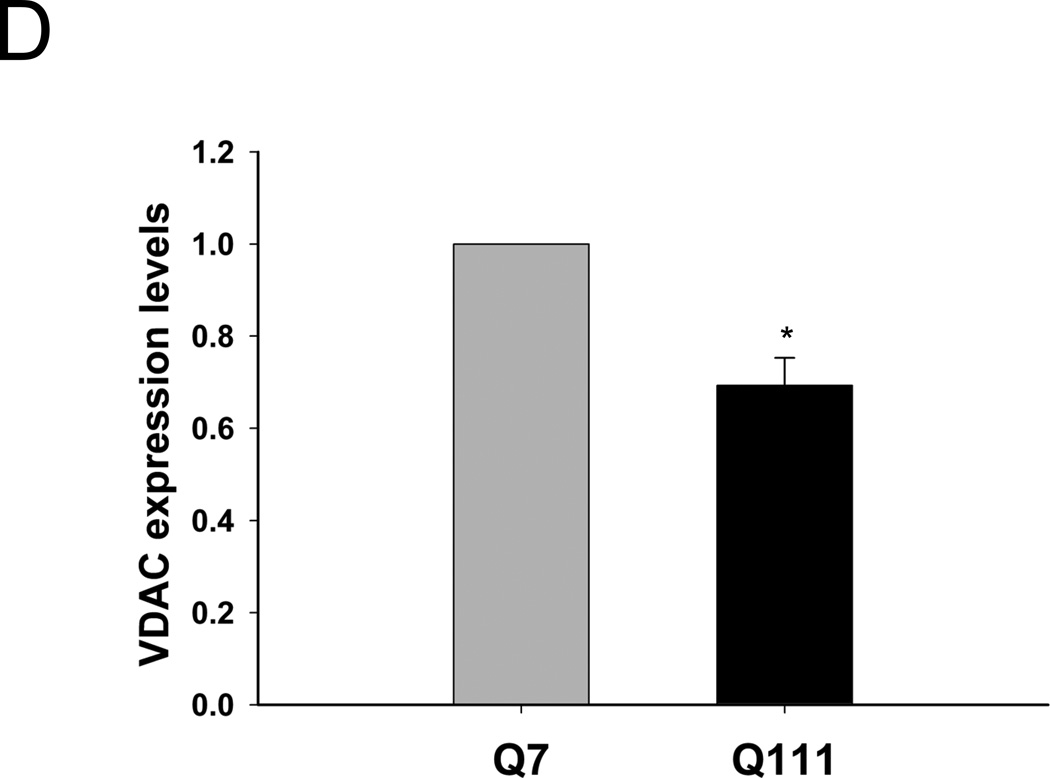
Mitochondrial superoxide production is increased in Q111 cells compared to wild type Q7 cells. Cells were cultured as described in Methods and live imaging was performed using a Zeiss LSM 510 confocal microscope. (A) Superoxide production was measured using MitoSOX™ red (2.5 µM) and mitochondria were detected using MitoTracker® green (50 nM). (B) The bar graph shows quantification of intensity of the fluorescence generated by MitoSOX™ after normalization using MitoTracker® fluorescence to correct for differences in mitochondrial abundance. The relative intensity of the fluorescence was determined using NIH Image J. *p=0.03 and n=2 independent experiments. (C) MitoTracker® green fluorescence was normalized for changes in cell numbers; **p=0.02. (D) Quantification of the expression levels of the mitochondrial protein VDAC by Western blot analysis (n=2 independent experiments; *p<0.05). Data are expressed relative to Q7 cells.


