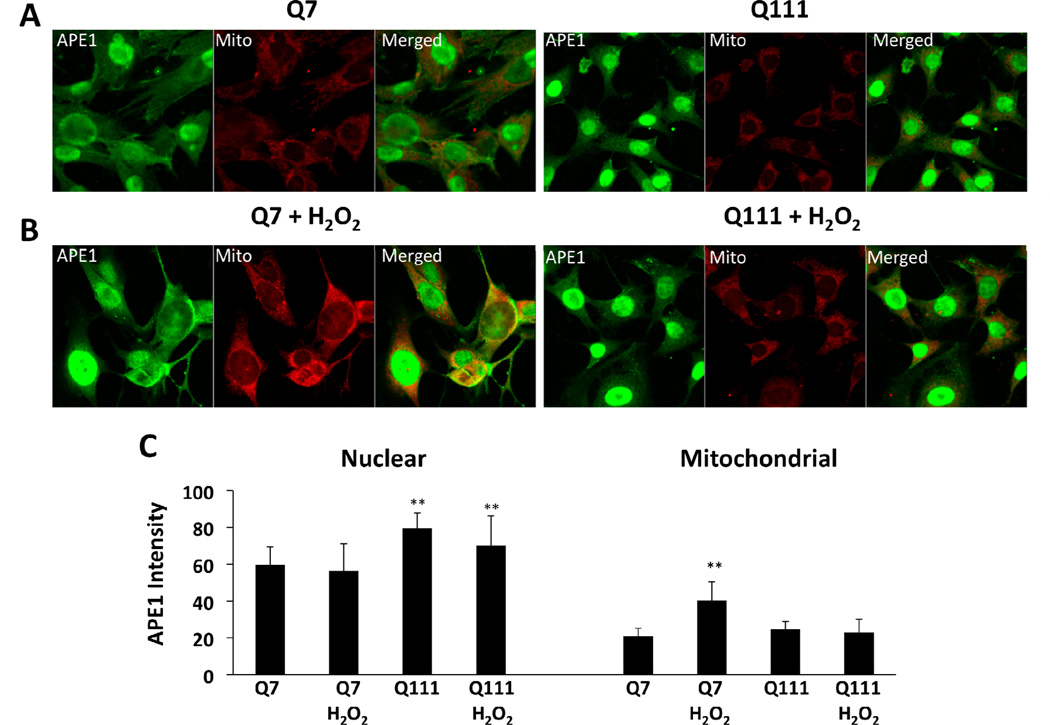
Fig. 7.
APE1 intensity increases in the mitochondria of Q7 but not in Q111 cells following hydrogen peroxide treatment. Cells were cultured as described in Methods, treated with 200 µM H2O2 for 6 hours, fixed and stained for APE1 (green) and mitochondria (red). (A) Confocal images of untreated Q7 and Q111 cells. (B) Confocal images of H2O2 treated Q7 and Q111 cells. (C) APE1 intensity after line scans were performed in 3 different fields with n=3; **p< 0.01 versus Q111 after H2O2 treatment. (D) Representative membrane showing APE1 expression in isolated mitochondria (upper panel). Expression levels of APE1 normalized using VDAC expression (lower panel). Data are expressed relative to Q7 control cells; n=2 independent experiments. *p< 0.02 versus Q7 control; **p <0.005 versus Q7 control and Q7 H2O2.

