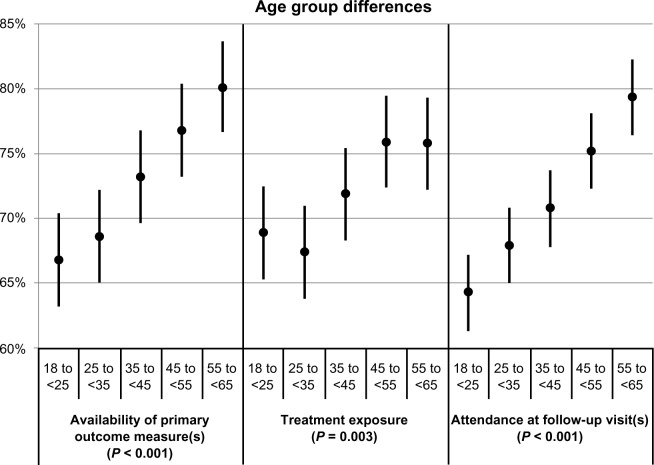
Figure 3.
Associations of age group with the availability of primary outcome measures, treatment exposure, and attendance at follow-up visits.a
Notes: aLeast-squares means and corresponding 95% confidence intervals by age group, for each of the three participation measures. The indicated P-values reflect the comparison between age groups.

